
Freeze Drying Time Chart: How to Determine a Realistic Food Freeze-Drying Cycle
This freeze drying time chart gives food manufacturers documented commercial project references and factory pilot-test records for fruit, vegetables, prepared foods, meat, seafood and liquids. It also explains why useful commercial freeze-drying time cannot be calculated reliably from a simple formula and how engineering teams establish a realistic cycle through relevant experience and product testing.
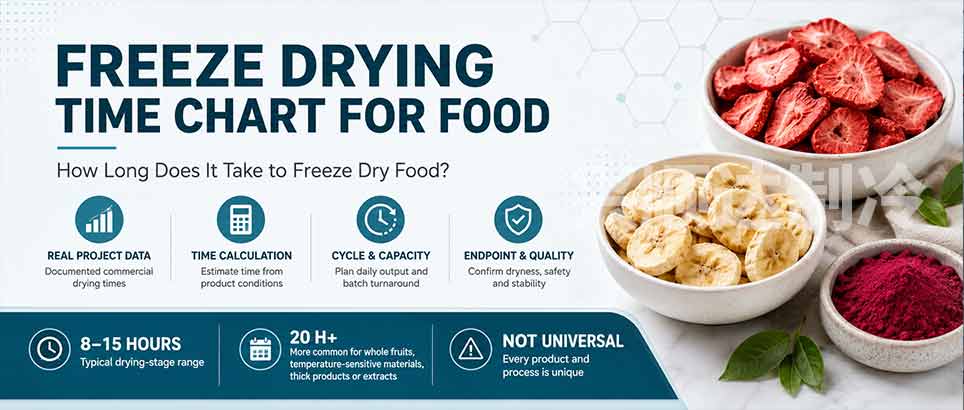
A freeze drying time chart is useful as a reference, but it is not a universal recipe. Many documented commercial food projects complete the drying stage in approximately 8–15 hours. However, whole fruit, thick products, liquids, extracts and other difficult materials may require longer.
More importantly, a useful industrial drying time cannot normally be calculated accurately from moisture content, product thickness, loading density and chamber pressure alone. Mathematical freeze-drying models exist, but practical prediction requires product- and equipment-specific heat and mass transfer parameters that are often unknown before testing.
Commercial Freeze Drying Time Chart Based on Documented Projects
The following records come from linked customer projects completed by Fuzhou Xing Shun Da Refrigeration Facility Project Co., Ltd. Each row connects the recorded drying-stage time with equipment area, prepared wet load, loading density and final moisture.
Fruit and Vegetable Project Times
| Food and project | Equipment / area | Prepared wet load | Loading reference | Recorded drying-stage time | Final moisture | Process note |
|---|---|---|---|---|---|---|
| Pineapple slices | SDG700 / 20 m² | Approx. 244 kg | 12.2 kg/m² | 12 hours | 2.31% | Round slices cut perpendicular to the fruit axis. |
| Apple slices | SDG700 / 20 m² | Approx. 254 kg | 12.7 kg/m² | 12 hours | 1.97% | About 8 mm thickness after production testing. |
| Pear slices | SDG3000 / 100 m² | Approx. 1,200 kg | 12 kg/m² | 12 hours | 2.21% | Industrial fruit project using electric and steam utilities. |
| Radish slices | SDG60 / 3 m² | Approx. 39.6 kg | 13.2 kg/m² | 12 hours | 2.09% | Pilot-scale vegetable reference for later scale-up. |
| Perforated blueberries | SDG1100 / 30 m² | Approx. 360 kg | 12 kg/m² | 13 hours | 1.97% | Skin perforation improved the moisture-release path. |
| Durian pieces | SDG1100 / 30 m² | Approx. 390 kg | 13 kg/m² | 13 hours | 2.09% | The fruit was frozen first and then cut into pieces. |
Meals, Meat, Seafood and Special Product Times
| Food and project | Equipment / area | Prepared wet load | Loading reference | Recorded drying-stage time | Final moisture | Process note |
|---|---|---|---|---|---|---|
| Cooked fried rice | SDG350 / 10 m² | Approx. 125 kg | 12.5 kg/m² | 6 hours | 1.28% | Cooked starch, oil, seasonings and mixed ingredients. |
| Shrimp for instant noodle toppings | SDG6000 / 200 m² | Approx. 2,320 kg | 11.6 kg/m² | 8 hours | 1.68% | Large seafood batch with steam-assisted heating. |
| Meat chunks | SDG350 / 10 m² | Approx. 121 kg | 12.1 kg/m² | 12 hours | 1.49% | About 10 mm thickness selected after comparative tests. |
| Instant tremella soup | SDG700 / 20 m² | Approx. 600 kg | 30 kg/m² | 20 hours | 1.94% | The unusually high loading density substantially increased the drying burden. |
Important: even when two products have a similar wet loading density, their drying times can differ because composition, structure, freezing behavior, product temperature, heat transfer and vapor resistance are different.
Factory Pilot Tests: Solid Foods
The following factory pilot records provide additional first-party references for loading density, recorded drying time and final moisture. Where available, the planning note also includes measured output or yield. These records are useful for identifying approximate ranges, but they should not be transferred directly to a new formulation without testing.
| Food tested | Loading density | Recorded drying-stage time | Final moisture | Planning note |
|---|---|---|---|---|
| Shrimp | 16.16 kg/m² | 13 h 56 min 53 s | 1.00% | 0.30 m² factory pilot test conducted in 2023; 4,849.30 g prepared input, 1,094.87 g freeze-dried output and 22.6% measured yield. Video documentation published in 2026. |
| Carrot dices | 16.4 kg/m² | 13 hours | 1.51% | Dice size and pretreatment should be reproduced before comparison. |
| Chicken breast chunks | 14 kg/m² | 12 hours | 1.84% | Piece thickness and composition influence the drying path. |
| Lemon | 11.06 kg/m² | 11.25 hours | 2.07% | Slice thickness and peel structure affect moisture movement. |
| Strawberry slices | 10.56 kg/m² | 12 hours | 2.32% | Maturity, sugar level and slice thickness should be controlled. |
| Eggplant strips | 8.59 kg/m² | 12.25 hours | 1.89% | Strip size and pretreatment affect shape and texture. |
| Beet dices | 12 kg/m² | 11 hours | 1.49% | Cube size and color retention should be checked during testing. |
Factory Pilot Tests: Liquids and Concentrates
| Food tested | Loading density | Recorded drying-stage time | Final moisture | Planning note |
|---|---|---|---|---|
| Milk | 15 kg/m² | 11.5 hours | 1.00% | Filling depth and solids content should be controlled during repeat testing. |
| Concentrated tea liquid | 12 kg/m² | 12 hours | 2.31% | Solids content and liquid depth are important for repeatability. |
Candy Processing: Real Engineering Test Data
The following candy times come from actual engineering tests performed after machine preheating. They are valid project data, but they should be interpreted separately from conventional food freeze-drying cycles.
| Product | Recorded processing time | Engineering interpretation |
|---|---|---|
| Marshmallows | About 1 hour | Actual engineering test result after machine preheating. |
| Hard candy | About 1.5 hours | Actual engineering test result after machine preheating. |
| Gummy candy | About 2 hours | Actual engineering test result after machine preheating. |
What Does Freeze Drying Time Actually Mean?
Drying-Stage Time
The period required to remove the necessary frozen and bound moisture until the defined product endpoint is reached.
Machine Cycle Time
Drying-stage time plus machine-related operations such as vacuum establishment, pressure release and other required chamber steps.
Full Production Turnaround
The total factory sequence including loading, drying, unloading, defrosting and the preparation needed before the next planned batch.
Readers who need the underlying process can review the freeze-drying working principle guide .
Can Freeze Drying Time Be Calculated Accurately?
In practical commercial food engineering, a useful freeze drying time usually cannot be calculated accurately from a few easily measured inputs.
A common search for freeze drying time calculation assumes that moisture content, product thickness, chamber pressure and loading density can be entered into a formula to produce a reliable number of hours. In real production, the problem is much more complex.
Mathematical models of freeze drying do exist. However, meaningful prediction may require information such as product-specific heat and mass transfer behavior, resistance of the dried layer, thermal properties, ice structure, effective heat transfer conditions and equipment-specific boundary conditions.
Many of these parameters are not known accurately before testing. They can also change with formulation, freezing history, piece geometry, equipment scale and loading conditions.
In commercial food production, the more practical approach is to use similar historical projects to establish an initial range and then determine the actual cycle through testing.
Why Freeze Drying Time Is Difficult to Predict
Product Structure
An intact berry, an 8 mm slice, a meat cube and a liquid layer create different moisture-transfer paths even at similar wet loading.
Composition
Sugar, protein, fat, salt and soluble solids influence freezing behavior, product temperature limits and resistance during drying.
Freezing History
Freezing rate and resulting ice structure influence the internal channels through which vapor later moves.
Dry-Layer Resistance
As drying progresses, vapor must pass through the already dried region. This resistance is product-specific and changes during the cycle.
Product Temperature
The material must receive enough heat to support sublimation without exceeding its safe process temperature.
Absolute Chamber Pressure
The appropriate pressure depends on product behavior, heat transfer, dry-layer resistance, vapor load and condenser performance.
Vapor Load
Water release is not constant throughout the cycle. Peak vapor flow can affect chamber pressure and condenser behavior.
Equipment Design
Heat-transfer arrangement, chamber geometry, refrigeration, condenser, vacuum system and control strategy all influence the loaded process.
The freeze-drying temperature and pressure guide discusses this relationship in more detail.
How Engineers Establish an Initial Freeze-Drying Time Range
Before a new product has been tested, the objective is not to calculate an exact drying time. The objective is to identify the most relevant historical reference and define a reasonable starting condition for testing.
Identify the Product Form
Determine whether the material is sliced, diced, intact, cooked, liquid, concentrated or multi-ingredient.
Compare Physical Structure
The closest reference should have a similar moisture path and physical structure, not simply a similar product name.
Compare Thickness or Liquid Depth
A large difference in product geometry can make an otherwise similar historical cycle unsuitable as a reference.
Compare Loading Density
Wet loading in kg/m² helps determine whether the new product is being loaded under conditions close to the historical project.
Review Composition and Quality Targets
Sugar, fat, solids, texture, shape and final-moisture requirements can shift the useful cycle significantly.
Use the Result Only as a Test Starting Point
The historical range guides the initial test. It does not replace actual cycle development.
How Pilot Testing Determines the Actual Freeze-Drying Cycle
For a new food, the most useful drying time is the time demonstrated under defined process conditions rather than a number produced by a theoretical formula.
A pilot test allows the engineering team to observe how the actual product behaves as product temperature, heat input, absolute pressure and vapor load change. The result can then be adjusted and repeated until the required product endpoint and acceptable cycle consistency are achieved.
- Can the material remain within its acceptable process condition throughout drying?
- Does the selected cycle reach the required final product condition consistently?
- Can the cycle be reproduced at the intended loading before scale-up?
Pilot testing is especially important for whole fruit, skin-covered products, high-sugar materials, high-fat formulations, liquids, extracts, multi-ingredient meals and products with strict texture or appearance requirements.
The food R&D and pilot freeze dryer guide explains the role of testing before commercial scale-up.
What Data Should Be Recorded During Freeze-Drying Tests?
Historical process data becomes valuable only when the conditions behind the recorded drying time are documented.
- Prepared wet load.
- Usable loading area.
- Wet loading density in kg/m².
- Slice thickness, piece dimensions or liquid depth.
- Pre-freezing condition.
- Product temperature during the process.
- Heating conditions.
- Absolute chamber pressure.
- Condenser operating condition.
- Recorded drying-stage time.
- Final moisture.
- Center dryness of representative pieces.
- Product color, shape, texture and rehydration where relevant.
- Differences between tray positions.
- Repeatability between batches.
Without these conditions, a statement such as “this fruit dries in 12 hours” has limited engineering value.
What Is Water-Load Calculation Useful For?
Although water balance cannot calculate reliable drying time, it remains useful for equipment and production planning.
For example, 1,000 kg of prepared material at 80% initial moisture contains approximately 200 kg of dry solids. If the target final moisture is 3%, the estimated final product weight is about 206.2 kg, meaning approximately 793.8 kg of water must leave the product.
Water-load calculations are useful when reviewing total condenser demand, approximate finished yield and equipment capacity. However, total water capacity should also be distinguished from peak vapor-capture performance.
The freeze dryer condenser guide explains this distinction.
How a Verified Freeze-Drying Cycle Becomes Daily Production Capacity
Once the product cycle has been demonstrated through relevant testing, the verified batch loading and full turnaround can be used for production planning.
In practice, factories may also apply a utilization factor or schedule only complete batches. Therefore, the result should be treated as a production-planning estimate rather than a guaranteed output.
Buyers can review the food freeze dryer capacity guide for a broader discussion of wet loading and equipment scale.
Why Supplier Freeze Dryer Capacity Claims Can Differ
Two suppliers can quote different daily capacities for equipment with a similar nominal loading area because the assumed process basis may be different.
- Usable loading area.
- Prepared wet kilograms per batch.
- Assumed wet loading density.
- Product type and geometry used as the reference.
- Whether drying time is based on an actual project, testing or assumption.
- Full turnaround used in the capacity estimate.
- Expected batches per day.
- Final-moisture basis.
- Condenser-duty basis.
If a supplier gives only a headline kg/day figure without explaining the product, loading and verified cycle behind it, the buyer cannot easily determine whether that capacity is realistic for the intended food.
How to Reduce Freeze-Drying Cycle Time Safely
Once a product cycle has been established, engineering work can focus on removing unnecessary resistance and turnaround losses. The objective is not to force a theoretical time target, but to improve a verified process without sacrificing product quality or consistency.
- Standardize product thickness: controlled cutting reduces variation in the moisture path between pieces.
- Keep loading even: avoid overfilled trays, thick corners and large differences between shelves.
- Open suitable surface barriers: controlled cutting or perforation may help skin-covered products such as berries when product quality allows it.
- Control liquid depth: repeatable filling depth improves consistency between trays and batches.
- Complete pre-freezing: confirm that the product is sufficiently frozen and minimize thawing during transfer.
- Use appropriate absolute pressure: the useful setpoint must fit the product, heat transfer, dry-layer resistance, vapor load and condenser behavior.
- Match condenser performance: adequate total capture capacity does not remove the need to handle peak vapor load.
- Control product temperature: heat input should support sublimation while keeping the product within its acceptable process limit.
- Verify the endpoint: remove unnecessary holding time only after representative samples consistently meet the defined endpoint.
How to Confirm That Freeze Drying Is Complete
A timer alone should not define the endpoint. A product may appear dry on the surface while retaining moisture internally, and different chamber positions may not finish at exactly the same time.
Drying Endpoint Checks
- Final moisture content.
- Center dryness in representative pieces.
- Mass stability where practical.
- Samples from different tray and chamber positions.
Product Acceptance Checks
- Color, shape and sensory condition.
- Texture or crispness where relevant.
- Rehydration performance.
- Batch-to-batch consistency.
- Packaging and shelf-life verification.
Food safety must be considered separately from the drying endpoint. Freeze drying should not automatically be treated as a validated microbial kill step unless product- and process-specific evidence supports that conclusion.
Covered U.S. food facilities can refer to the U.S. FDA Preventive Controls for Human Food for hazard analysis and preventive-control requirements.
Why Home Freeze Dryer Time Charts Do Not Fit Commercial Production
| Equipment level | Main purpose | How time should be interpreted | Scale-up value |
|---|---|---|---|
| Home unit | Household preservation and small recipes | Automatic programs may combine freezing, drying and extra hold time. | Useful for basic feasibility, but not a reliable basis for industrial capacity planning. |
| Lab / pilot system | Product testing and scale-up data | Cycle stages and process records can be developed under controlled conditions. | High when the test method and larger system have compatible process principles. |
| Commercial system | Regular batch production | Cycle time should be based on tested products and defined loading conditions. | Suitable for direct production and later expansion planning. |
| Industrial system | Factory-scale production | Production planning must include loading logistics, utilities, defrost strategy and full turnaround. | Requires product data, verified cycle assumptions and plant-level planning. |
A home freeze dryer time chart should not be copied directly into an industrial capacity proposal. Equipment scale changes heat transfer, vapor flow, condenser loading, sensor response, loading logistics and defrost requirements.
Submit Product Data for a Reference Case and Pilot-Test Recommendation
A reliable food freeze-drying proposal should begin with the actual product, not an assumed universal cycle. The engineering team can compare the material with relevant historical projects and recommend a suitable testing path before final equipment sizing.
Useful information includes product type, prepared wet load, moisture or solids, thickness or liquid depth, expected daily output, product photos and required final quality.
Frequently Asked Questions
How long does it take to freeze dry food?
Many documented commercial food projects shown in this chart have drying stages of approximately 8–15 hours. However, actual time depends on the product, geometry, loading, process conditions and equipment. A new product should be verified through testing.
Can freeze drying time be calculated from moisture content?
Not reliably for commercial food production. Moisture content can be used to estimate the total amount of water that must be removed, but it does not determine how quickly that water can be removed. Drying rate depends on heat transfer, product resistance, temperature, pressure, vapor load and equipment behavior.
Is there a freeze drying time calculation formula?
Mathematical models exist, but they require product- and equipment-specific parameters that are often unavailable before testing. Therefore, a simple formula using only moisture, thickness and chamber pressure does not normally provide a reliable industrial drying time.
How should drying time for a new food be estimated?
The practical method is to identify the closest historical product and process reference, use that information to define an initial test range, and then establish the actual cycle through pilot or production testing.
Does lower vacuum pressure always reduce freeze drying time?
No. The useful absolute pressure depends on product temperature, heat transfer, dry-layer resistance, vapor load and condenser behavior. An unnecessarily low pressure can slow heat transfer, while excessive pressure may compromise the intended process condition.
Why does the shrimp pilot test take longer than the commercial shrimp reference?
The documented 200 m² Kochi production reference records about 8 hours at 11.6 kg/m² with 1.68% final moisture. The 2023 factory pilot test records 13 h 56 min 53 s at 16.16 kg/m² with 1.00% final moisture. The pilot loading was about 39.3% higher and its final moisture target was lower, but the time difference should not be attributed to loading alone. Shrimp geometry, preparation, freezing history, heat input, absolute pressure, vapor load and equipment configuration can also change the cycle.
Can a freeze drying time chart replace pilot testing?
No. A time chart provides historical references and helps select a starting range. The actual cycle for a new product should be confirmed under defined loading and equipment conditions.
When can drying time be used to calculate daily capacity?
Drying time becomes useful for capacity planning after the product cycle has been demonstrated. The verified drying stage must then be combined with loading, vacuum establishment, unloading, defrosting and other turnaround steps to estimate daily production.
Are the candy processing times in this article real engineering data?
Yes. The marshmallow, hard candy and gummy candy times shown above come from actual engineering tests performed after machine preheating. They should be interpreted as candy-specific test data and not compared directly with conventional fruit, meat or liquid food freeze-drying cycles.
Technical and Food-Safety References
These external references support the discussion of food freeze drying, product-specific process behavior and food-safety planning. Actual industrial cycle development should remain based on the material and equipment being used.
- Nowak, D.; Jakubczyk, E. The Freeze-Drying of Foods—The Characteristic of the Process Course and the Effect of Its Parameters on the Physical Properties of Food Materials. Foods 2020, 9(10), 1488. DOI: 10.3390/foods9101488 .
- U.S. FDA: FSMA Final Rule for Preventive Controls for Human Food — official information on hazard analysis and risk-based preventive controls for covered facilities.
- University of Minnesota Extension: Freeze-Drying Food Guidance — general food freeze-drying guidance; commercial production requires separate process and equipment validation.

About the Author
Zheng Wei — Founder & Freeze-Drying System Engineer
Zheng Wei has participated in food freeze-drying projects involving product testing, equipment sizing, vacuum-system configuration, refrigeration planning, installation guidance and process optimization for fruit, vegetables, prepared foods, meat, seafood, liquids, candy and botanical materials.
The commercial project drying times, factory pilot-test records and candy processing times presented in this article are first-party engineering references. They are intended to help readers understand realistic ranges and process variables, not to provide universal cycle guarantees for untested products.
Engineering data reviewed against the linked project references. Last updated: August 12, 2026.