
Food process engineering · Updated 18 July 2026
Freeze Drying Temperature for Food: Chart, Pressure & Process Control
Set a product-specific temperature window—not a copied machine number.
Freeze drying temperature can mean the pre-freezing condition, shelf setpoint, actual product temperature or condenser temperature. A reliable food cycle coordinates all four with absolute chamber pressure, layer thickness and water load.
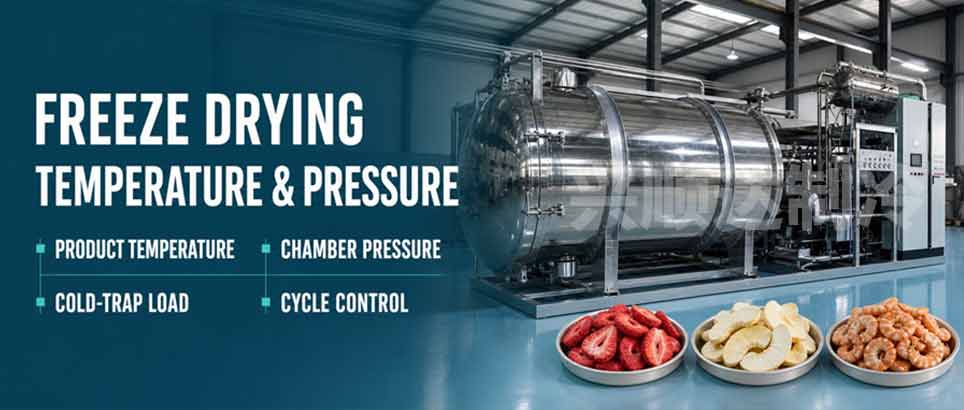
Freeze Drying Temperature Chart: What Each Number Actually Controls
A useful freeze drying temperature chart does not assign one recipe to “fruit,” “meat” or “milk.” It shows where a value is measured, what decision it controls and what must be verified before a setting is transferred to production.
Why laboratory conditions are not production recipes
Published food studies are useful for understanding mechanisms, but their shelf temperatures, chamber pressures and cycle times should not be presented as commercial operating recipes. Laboratory results depend on the tested formulation, sample depth, batch size, freezing history, sensor arrangement, equipment geometry and endpoint definition. Controlled studies have shown that shelf temperature and pressure can influence product quality, drying behavior and energy use, but those findings still require scale-up and validation under representative production loading.[3][4]
Real food freeze-drying project examples
The following project data illustrate real food-processing scale and verified batch outcomes documented on this website. They are included as engineering experience—not as universal temperature or pressure settings.
| Product | Project scale / loading | Product geometry | Drying time | Final moisture |
|---|---|---|---|---|
| Pear slices | 100 m² freeze-drying area | 8 mm slices | 12 h | 2.21% |
| Blueberries | 30 m² freeze-drying area | Project-specific whole-fruit process | 13 h | 1.97% |
| Durian | 30 m² freeze-drying area | Project-specific product loading | 13 h | 2.09% |
| Shrimp | 200 m² freeze-drying area | Commercial production load | 8 h | 1.68% |
| Milk | 14.96 kg/m² tray loading | Liquid layer under project-specific loading | 11.5 h | 0.99% |
Engineering boundary: these projects show production scale, loading context, drying time and final moisture. Shelf temperature, product temperature and chamber pressure were developed for each product and equipment configuration and should not be copied as universal recipes.
Control chart: what each number actually controls
| Process value | What it controls | Safe interpretation | What it cannot prove |
|---|---|---|---|
| Pre-freezing / final frozen product temperature | Ice formation and whether the complete food matrix is frozen before vacuum. | The product must be below its product-specific freezing-completion or eutectic region. | A chamber reading alone does not prove the warmest product position is fully frozen. |
| Shelf or heating-plate temperature | Heat supplied to trays and product during primary and secondary drying. | Use it as an input that influences product temperature and sublimation rate. | A shelf setpoint is not the food temperature and is not a transferable recipe. |
| Product temperature | Margin to eutectic melting, glass-transition-related collapse or another product limit. | During primary drying, representative product locations should remain below the applicable limit. | One sensor cannot demonstrate uniformity across every tray and product geometry. |
| Absolute chamber pressure | Sublimation conditions, gas-mediated heat transfer and vapor flow. | Pure water’s triple point—about 0.01°C and 611 Pa—is a physical boundary, not a production target. Food cycles normally operate with a larger pressure margin. | Ultimate vacuum does not show controllable pressure under active vapor load. |
| Condenser / cold-trap temperature | The vapor-pressure sink and the ability to capture water as ice. | Evaluate temperature and water-capture behavior throughout a loaded batch. | A no-load minimum does not show performance after frost thickens. |
The water triple-point reference and the need to distinguish product, shelf and pressure variables are described in food freeze-drying engineering literature.[1][2]
Readers who need the complete sequence from freezing through primary and secondary drying can review how freeze drying works. This page stays focused on temperature, pressure and process-control decisions.
Do Not Confuse the Four Temperatures
The same freeze dryer can display four very different temperatures at the same time. Confusing them is one of the fastest ways to copy an unsafe or inefficient cycle.
Pre-freezing temperature
Confirms that the slowest or warmest product position is frozen before vacuum. Freezer air, shelf and product readings may not match.
Shelf temperature
Controls heat input. During active sublimation, it can be substantially warmer than the product because energy is consumed by the phase change.
Product temperature
Shows how representative food locations respond to the combined shelf heat, pressure, geometry, composition and stage of drying.
Condenser temperature
Indicates the cold surface used to capture vapor. Loaded water-capture rate and pressure stability matter more than the lowest empty-machine reading.
For amorphous, sugar-rich foods, collapse behavior or glass-transition-related limits may be important. In more crystalline systems, eutectic melting can be the controlling risk. Whole pieces also create local variation in composition, thickness and vapor path. The correct limit therefore comes from the product—not a generic machine brochure.
How Freeze Drying Temperature and Pressure Work Together
Freeze drying temperature and pressure should be developed as a coupled process window. Product temperature cannot usually be manipulated directly; it responds to the shelf heat, chamber pressure, dry-layer resistance, tray contact, radiation and product geometry.[1]
Early in primary drying, the dry layer is thin. Later, vapor must move through an increasingly thick porous layer, so mass-transfer resistance can grow as drying proceeds. This is why the pressure and shelf setting that worked at the start may no longer be the best choice near the end of primary drying.
| Observed pattern | Possible process limit | Verify before changing a setpoint |
|---|---|---|
| Low product temperature, stable pressure, slow mass loss | Heat transfer may be limiting. | Layer thickness, shelf contact, sensor position and available condenser margin. |
| Pressure rises when shelf heat increases | Vapor load, condenser capture or vapor path may be limiting. | Condenser temperature under load, ice accumulation, valve position and leakage. |
| Product temperature approaches the critical limit | Product stability is limiting the heat input. | Critical-temperature method, warmest product location and measurement uncertainty. |
| Center positions stay wet while edges finish | Load and heat-transfer nonuniformity. | Tray distribution, thickness, contact, radiation and endpoint by position. |
Why the Same Temperature Cannot Be Used for Every Food
Food composition and structure change both the safe temperature limit and the rate at which water can escape. Plant-food research highlights the effects of sugar concentration, total solids, cuticle, sample size and freezing rate; these variables prevent a single setting from representing all products.[2]
| Product feature | Why it changes the cycle | What to standardize in a test |
|---|---|---|
| High-sugar puree or extract | Often has an amorphous freeze-concentrated phase and a narrow structural margin. | Solids, formulation, layer depth, critical-temperature evidence and target moisture. |
| Whole fruit or waxy skin | Skin can dominate vapor-flow resistance and cause bursting or very long primary drying. | Variety, size, maturity, pretreatment and skin condition. |
| Slices, meat or prepared meals | Thickness, orientation, fat, salt and local composition create different center and edge behavior. | Piece dimensions, tray load, spacing, recipe and cold-chain history. |
| High-solid liquid or powder precursor | Less freezable water may coexist with higher viscosity, smaller pores and greater resistance. | Solids concentration, aeration, freezing protocol, fill depth and reconstitution target. |
What laboratory research can still tell a production team
Laboratory studies remain useful when they are used to explain mechanisms rather than prescribe plant settings. Research on orange-based systems shows that changing shelf temperature and chamber pressure can alter drying behavior, product quality and energy demand.[3][4] Research on blueberries shows that the fruit skin and available vapor paths can strongly influence mass transfer.[5] Studies of high-solid food systems also show that freezing history can change pore structure and later reconstitution behavior.[6]
The engineering lesson is to identify the dominant resistance in the actual product, then verify it at representative loading. Published laboratory settings should support the test hypothesis—not become the production recipe.
How to Develop a Food Freeze-Drying Temperature Program
Use published ranges only to plan a conservative first experiment. A production recipe should come from a controlled test matrix using the actual product, geometry and representative load.
- Define the productRecord formulation, water or solids content, sugar, salt, fat, structure, intended packaging and final quality target.
- Standardize the loadFix slice thickness or fill depth, tray weight, spacing, initial temperature and total batch water load.
- Establish the limitUse suitable thermal analysis or justified product evidence to define a conservative critical-temperature margin.
- Record four curvesLog shelf, representative product, condenser temperature and absolute chamber pressure with alarms and cycle events.
- Change with a hypothesisAdjust heat and pressure only after identifying whether product stability, heat transfer, vapor flow or condenser capacity is limiting.
- Define the endpointCombine temperature convergence or pressure-response evidence with final moisture, center dryness, mass stability and position-based checks.
- Repeat at representative loadConfirm that upper, middle, lower, center and edge positions meet the same release criteria.
- Then discuss equipment scaleTranslate verified water load, tray area, cycle time, condenser demand and uniformity into the machine class.
Keep detailed cycle-duration calculations on the dedicated freeze-drying time and cycle page. For pilot work, use the food R&D and pilot-testing guide rather than turning an unverified chart into a production promise.
Turn your product data into a pilot-test brief
Send the product type, formulation or solids, piece thickness or liquid depth, tray load, planned wet batch, daily target, final moisture and any rehydration or shelf-life target.
The engineering team can use those inputs to structure a preliminary test matrix and discuss the relevant equipment class. Final settings still require validation with representative product.
What Temperature Problems Look Like in a Real Batch
Visible defects rarely identify one cause by themselves. Use them to choose the next measurement, not to justify an immediate temperature increase.
| Symptom | Possible cause | First checks |
|---|---|---|
| Collapse, meltback or loss of shape | Product exceeded its structural limit, or was not fully frozen. | Product sensors, critical limit, shelf ramp, warm positions and pressure stability. |
| Sticky or caked high-sugar product | Formulation, residual moisture or late-stage temperature exceeded the stable range. | Solids, glass-transition evidence, endpoint, packaging exposure and secondary drying. |
| Dry surface, wet center | Excess thickness, uneven heating or a center position that was not represented by sensors. | Thickness distribution, tray load, center temperature and position-based moisture. |
| Pressure oscillation after heating | Vapor generation exceeded condenser or vapor-path capacity. | Loaded condenser trend, frost accumulation, valve control, leakage and water load. |
| Safe but excessively long cycle | Conservative heat input, small pores, skin resistance, poor contact or excess layer depth. | Product geometry, freezing history, dry-layer resistance, shelf contact and available process margin. |
What Temperature Data Should a Freeze Dryer Supplier Provide?
A B2B comparison should go beyond minimum temperature and ultimate vacuum. Ask how the system measures, controls and records a representative loaded process. Because ultimate vacuum alone does not make the technologies equivalent, review the vacuum drying and freeze drying comparison before comparing specifications.
Measurement
Sensor type, accuracy, calibration approach and locations for shelf, product, condenser and absolute pressure.
Control
Programmable ramps, controllable pressure range, alarm logic, data export and recipe/version records.
Loaded performance
Water-capture rate, total ice capacity, pressure stability and condenser behavior as frost accumulates.
Uniformity and endpoint
Temperature and final-moisture evidence across tray levels and center/edge positions, including repeat batches.
Use the dedicated pages to compare freeze dryer specifications, understand condenser capacity and water capture, review monitoring and batch records, and plan food freeze dryer validation.
Buyers moving from process development to equipment selection can also use the commercial freeze dryer selection guide to compare capacity, loading and project requirements before requesting a quotation.
Frequently Asked Questions
What is the best freeze drying temperature for food?
There is no single best value for every food. The useful process window keeps representative product locations below the relevant structural limit during primary drying while supplying enough heat for efficient sublimation and maintaining stable vapor capture.
Is −40°C the correct freeze drying temperature?
It may be a pre-freezing, shelf-range or condenser reference, but it is not a universal product-drying temperature. Confirm which location and stage the number describes and whether the food is fully frozen.
What pressure is used for food freeze drying?
The appropriate freeze-drying pressure depends on the characteristics of the material, so different foods can require very different pressure ranges. Each product has a suitable operating pressure window that should be established through process testing. If the chamber pressure is too high for the product and drying stage, sublimation may become unstable or insufficient, increasing the risk of collapse, meltback or incomplete drying. However, operating at a pressure far below the appropriate range does not necessarily improve drying and may reduce heat transfer, slowing the sublimation rate and extending the cycle. Therefore, pressure should be optimized together with product temperature, shelf heat input and vapor-removal capacity rather than simply set as low as possible.
What is the difference between shelf and product temperature?
Shelf temperature is a controlled heat-input setting. Product temperature is measured inside representative food locations and responds to heat input, pressure, geometry, composition and cycle stage. During active sublimation, the two can differ substantially.
Does a lower temperature always improve freeze drying?
No. An unnecessarily low product temperature can reduce sublimation rate and throughput. The goal is to maintain a justified safety margin without making the cycle colder or longer than the product requires.
Develop the Process Before Finalizing the Machine
A useful proposal starts with the water to remove, the area and thickness required, the product’s safe temperature window and the loaded condenser demand.
- product, formulation and solids or moisture;
- piece thickness or liquid depth and tray load;
- wet batch, batches per day and quality target.
- which pilot variables need testing;
- what process and sensor evidence to request;
- whether commercial or industrial scale fits the validated load.
References
- Ratti C. Freeze drying for food powder production. In: Handbook of Food Powders. Woodhead Publishing; 2013:57–84. https://doi.org/10.1533/9780857098672.1.57
- Bhatta S, Stevanovic Janezic T, Ratti C. Freeze-Drying of Plant-Based Foods. Foods. 2020;9(1):87. https://doi.org/10.3390/foods9010087
- Silva-Espinoza MA, Ayed C, Foster T, Camacho MdM, Martínez-Navarrete N. The Impact of Freeze-Drying Conditions on the Physico-Chemical Properties and Bioactive Compounds of a Freeze-Dried Orange Puree. Foods. 2020;9(1):32. https://doi.org/10.3390/foods9010032
- Silva-Espinoza MA, Camacho MdM, Martínez-Monzó J, Martínez-Navarrete N. Impact of the Freeze-Drying Conditions Applied to Obtain an Orange Snack on Energy Consumption. Foods. 2021;10(11):2756. https://doi.org/10.3390/foods10112756
- Munzenmayer P, Ulloa J, Pinto M, Ramirez C, Valencia P, Simpson R, Almonacid S. Freeze-Drying of Blueberries: Effects of Carbon Dioxide (CO2) Laser Perforation as Skin Pretreatment to Improve Mass Transfer, Primary Drying Time, and Quality. Foods. 2020;9(2):211. https://doi.org/10.3390/foods9020211
- Malik N, Gouseti O, Bakalis S. Effect of freezing on microstructure and reconstitution of freeze-dried high solid hydrocolloid-based systems. Food Hydrocolloids. 2018;83:473–484. https://doi.org/10.1016/j.foodhyd.2018.05.008