
Freeze Drying Time Chart: How Long Does It Take to Freeze Dry Food?
This freeze drying time chart helps food manufacturers compare documented drying records, calculate cycle capacity, check endpoints and decide when pilot testing is necessary.
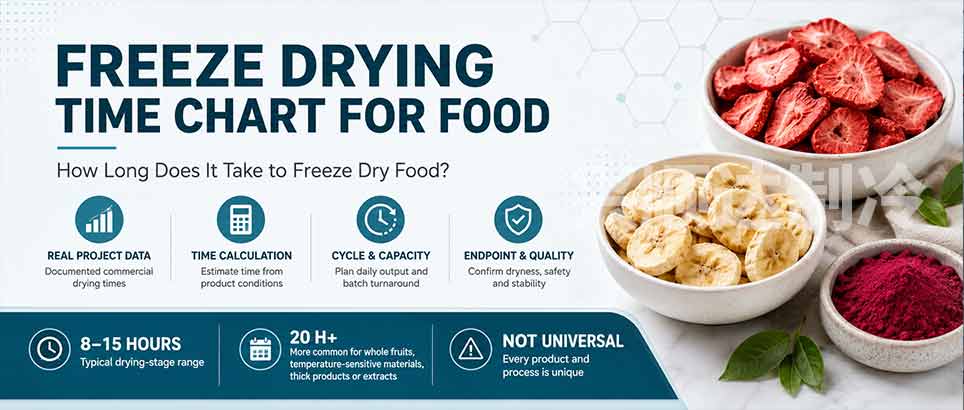
This freeze drying time chart is an engineering reference, not a universal recipe. Many documented commercial food projects complete the drying stage in about 8–15 hours. However, whole fruits such as whole strawberries, temperature-sensitive materials, thick products and extracts may require approximately 20 hours or longer.
Drying-stage time does not equal the full production cycle. A factory must also plan preparation, pre-freezing, loading, vacuum pull-down, pressure release, unloading, defrosting, cleaning and packaging transfer.
Commercial Freeze Drying Time Chart Based on Documented Projects
The following records come from linked customer projects completed by Fuzhou Xing Shun Da Refrigeration Facility Project Co., Ltd. Each row connects the recorded drying-stage time with equipment area, prepared wet load, loading density and final moisture.
Fruit and Vegetable Project Times
| Food and project | Equipment / area | Prepared wet load | Loading reference | Recorded drying-stage time | Final moisture | Process note |
|---|---|---|---|---|---|---|
| Pineapple slices | SDG700 / 20 m² | Approx. 244 kg | 12.2 kg/m² | 12 hours | 2.31% | Round slices cut perpendicular to the fruit axis. |
| Apple slices | SDG700 / 20 m² | Approx. 254 kg | 12.7 kg/m² | 12 hours | 1.97% | About 8 mm thickness after production testing. |
| Pear slices | SDG3000 / 100 m² | Approx. 1,200 kg | 12 kg/m² | 12 hours | 2.21% | Industrial fruit project using electric and steam utilities. |
| Radish slices | SDG60 / 3 m² | Approx. 39.6 kg | 13.2 kg/m² | 12 hours | 2.09% | Pilot-scale vegetable reference for later scale-up. |
| Perforated blueberries | SDG1100 / 30 m² | Approx. 360 kg | 12 kg/m² | 13 hours | 1.97% | Skin perforation improved the moisture-release path. |
| Durian pieces | SDG1100 / 30 m² | Approx. 390 kg | 13 kg/m² | 13 hours | 2.09% | The fruit was frozen first and then cut into pieces. |
Meals, Meat, Seafood and Special Product Times
| Food and project | Equipment / area | Prepared wet load | Loading reference | Recorded drying-stage time | Final moisture | Process note |
|---|---|---|---|---|---|---|
| Cooked fried rice | SDG350 / 10 m² | Approx. 125 kg | 12.5 kg/m² | 6 hours | 1.28% | Cooked starch, oil, seasonings and mixed ingredients. |
| Shrimp for instant noodle toppings | SDG6000 / 200 m² | Approx. 2,320 kg | 11.6 kg/m² | 8 hours | 1.68% | Large seafood batch with steam-assisted heating. |
| Meat chunks | SDG350 / 10 m² | Approx. 121 kg | 12.1 kg/m² | 12 hours | 1.49% | About 10 mm thickness selected after comparative tests. |
| Instant tremella soup | SDG700 / 20 m² | Approx. 600 kg | 30 kg/m² | 20 hours | 1.94% | The 30 kg/m² loading density was far above the usual 11–13 kg/m² recommendation, which was the main reason for the 20-hour drying time. |
Planning limit: Product geometry, initial moisture, freezing conditions, equipment loading and quality targets can change the cycle. In the tremella soup project, the 30 kg/m² loading density was about 2.3–2.7 times the usual 11–13 kg/m² recommendation, so the 20-hour record should not be interpreted as a normal cycle for liquid foods. The engineering team should confirm a new product through pilot testing before using a project record as a production commitment.
Factory Pilot Tests: Solid Foods
The manufacturer’s engineering team measured the following records on a factory pilot freeze dryer. They provide nearby references for loading density, drying time and final moisture. However, each new formulation still requires confirmation of product size, pre-freezing condition, pressure, heating program and endpoint method.
| Food tested | Loading density | Recorded drying-stage time | Final moisture | Planning note |
|---|---|---|---|---|
| Carrot dices | 16.4 kg/m² | 13 hours | 1.51% | Confirm dice size and blanching conditions before scale-up. |
| Chicken breast chunks | 14 kg/m² | 12 hours | 1.84% | Define piece thickness and the separate food-safety plan. |
| Lemon | 11.06 kg/m² | 11.25 hours | 2.07% | Slice thickness, peel structure and acidity affect the drying path. |
| Strawberry slices | 10.56 kg/m² | 12 hours | 2.32% | Control maturity, sugar level and slice thickness. |
| Eggplant strips | 8.59 kg/m² | 12.25 hours | 1.89% | Strip size and pretreatment affect shape and texture. |
| Beet dices | 12 kg/m² | 11 hours | 1.49% | Check color retention and cube size during testing. |
Factory Pilot Tests: Liquids and Concentrates
| Food tested | Loading density | Recorded drying-stage time | Final moisture | Planning note |
|---|---|---|---|---|
| Milk | 15 kg/m² | 11.5 hours | 1.00% | Test filling depth, solids and foaming behavior. |
| Concentrated tea liquid | 12 kg/m² | 12 hours | 2.31% | Solids content and tray depth are critical for repeatability. |
Use of pilot data: An accurate proposal still needs usable shelf area, total wet load, product thickness or liquid depth, pre-freezing condition, chamber pressure, heating program, endpoint method and full turnaround time.
Candy Processing Is a Special Case
Some products sold as “freeze-dried candy” do not follow a complete frozen-water sublimation cycle. Instead, they use vacuum and controlled heat for low-pressure drying or puffing. In engineering tests performed after machine preheating, marshmallows required about 1 hour, hard candy about 1.5 hours and gummy candy about 2 hours.
What Does Freeze Drying Time Include?
Drying Time
The period from stable vacuum drying to the confirmed endpoint. It normally includes primary and secondary drying but may exclude preparation and pre-freezing.
Machine Cycle Time
Drying time plus vacuum pull-down, pressure release, unloading and the machine steps required before the chamber can open safely.
Full Production Cycle
Preparation, pre-freezing, transfer, loading, drying, unloading, defrosting, cleaning, inspection and packaging-room transfer.
Consequently, an “8-hour drying cycle” does not always mean that a factory can run three batches every 24 hours. The actual daily output depends on the complete turnaround time and the operating utilization rate.
For a stage-by-stage explanation, the industrial food freeze-drying process guide explains pre-freezing, primary drying, secondary drying and endpoint verification.
Why Freeze Drying Time Varies
Food freeze-drying research supports the same practical conclusion seen in factory projects: drying time is controlled by heat transfer, vapor movement and the product endpoint, not by the machine model alone. Thickness, initial moisture, chamber pressure, shelf or heating temperature, freezing method, condenser performance and endpoint moisture all affect the result.
- Food thickness and initial moisture strongly affect drying rate, so slice size or liquid depth must be recorded before estimating cycle time.
- Primary drying and secondary drying behave differently; a pressure or temperature setting that helps one stage may not be ideal for the other.
- Water activity and final moisture testing are better endpoint checks than a fixed timer alone.
- Pretreatments such as perforation, controlled cutting, concentration, blanching, ultrasound or freeze-thaw steps may shorten drying, but they must be tested against color, texture, nutrition and rehydration quality.
1. Thickness and Liquid Depth
Moisture inside a thick piece or deep liquid layer travels farther before reaching the surface. Therefore, doubling thickness can extend the cycle by much more than a simple linear estimate.
2. Initial Moisture and Solids
A high-moisture food creates a larger ice load. Meanwhile, concentrated sugar, salt and soluble solids can change freezing behavior, product resistance and safe product temperature.
3. Skin and Surface Barriers
Blueberries, grapes and other intact fruits resist vapor movement. Cutting, scoring or controlled perforation can create a shorter mass-transfer path when product quality allows it.
4. Loading Density
Many sliced-food projects use roughly 10–13 kg/m². However, the correct value depends on product structure and layer depth. Extra load can reduce daily output if it extends the cycle too far.
5. Freezing Conditions
Air temperature alone does not confirm that the product center is fully frozen. Freezing rate and ice-crystal structure also influence vapor pathways and final rehydration behavior.
6. Product Temperature and Heat Input
Primary drying needs controlled energy. Too little heat slows sublimation, while excessive heat can cause melting, collapse, shrinkage, browning or aroma loss.
7. Vacuum Stability
The lowest empty-chamber pressure is not the main target. A loaded process requires a stable pressure range that supports heat transfer and vapor movement without overloading the condenser.
8. Condenser Performance
The cold trap must capture both the total water load and the peak vapor flow. Insufficient capture performance can increase chamber pressure and lengthen the cycle.
9. Final Moisture Target
Removing the last portion of bound moisture can take significant time. A lower final-moisture target may improve a defined quality attribute, but it can also reduce throughput and raise energy use.
10. Endpoint Method
A fixed timer may stop too early or run too long. Product temperature, pressure response, moisture testing and water activity provide stronger evidence than time alone.
Buyers can examine the separate guides to freeze-drying temperature and pressure, condenser capacity and vacuum pump sizing when comparing quotations.
Freeze Drying Time Calculation for a New Food
A useful estimate begins with water removal and product geometry. It does not begin with tray quantity or the finished product weight.
Define the Prepared Wet Material
Use the material that actually enters the freeze dryer after washing, peeling, cooking, draining, concentration or other preparation.
Calculate the Water to Be Removed
Estimate dry solids, expected finished weight and removable water. This determines the approximate vapor load placed on the chamber and condenser.
Record Thickness or Liquid Depth
Specify slice thickness, cube dimensions, whole-fruit pretreatment or liquid depth. A product name without geometry is not enough for a cycle estimate.
Set the Wet Loading Density
Record kilograms per square meter and confirm that the layer remains even across trays. Inconsistent loading creates different endpoints within one batch.
Select the Closest Verified Reference
Compare products with similar structure, moisture, sugar, fat, thickness and target quality. An apple reference should not be transferred directly to soup or raw meat.
Run and Repeat a Pilot Test
Record product temperature, shelf or heat-medium temperature, chamber pressure, condenser temperature, wet load, time, final moisture and water activity.
For example, 1,000 kg of prepared fruit at 80% initial moisture contains 200 kg of dry solids. At a 3% target final moisture, the estimated finished weight is about 206.2 kg. Therefore, the process must remove approximately 793.8 kg of water.
The food freeze dryer capacity guide provides a broader method for matching wet load, usable shelf area, condenser capacity and model range.
How Cycle Time Changes Daily Production Capacity
Daily output must use full turnaround time rather than drying time alone. Otherwise, a capacity estimate can ignore loading, vacuum establishment, unloading, defrosting and cleaning.
Illustrative Capacity Calculation
Assume a fruit project loads 244 kg per batch. The recorded drying time is 12 hours, while loading, unloading and turnaround add 1.5 hours. If the plant uses an 85% operating factor, the planning estimate becomes:
This calculation is only an example. The real plant may schedule complete batches, planned sanitation, shift changes and maintenance differently. Nevertheless, it shows why “batch capacity” and “24-hour capacity” should not be treated as the same specification.
Cycle time also changes operating cost. A longer full turnaround reduces daily wet capacity and can increase electricity, steam, labor and depreciation per kilogram of water removed. For a broader cost model, review the industrial freeze dryer cost calculation guide.
- Product name, ingredient list and photos before and after preparation.
- Initial moisture or solids content, target final moisture and target water activity if available.
- Slice thickness, cube size, whole-piece diameter or liquid filling depth.
- Prepared wet kilograms per batch and expected daily or monthly output.
- Available utilities such as electricity, steam, cooling water, compressed air and production-room temperature.
- Quality targets such as color, shape, crispness, aroma, rehydration, nutrient retention, packaging and shelf-life requirement.
Need a Cycle and Capacity Estimate for a Specific Food?
The engineering review can compare product moisture, thickness, wet load, final quality, available utilities and production target. It can then recommend a pilot-test path, usable area range, condenser basis, cycle assumptions and suitable equipment category.
How to Reduce Freeze Drying Time Safely
The safest improvements reduce resistance or lost time without pushing the product above its safe temperature.
- Standardize thickness: Use controlled cutting or filling so every tray follows the same moisture path.
- Keep loading even: Avoid thick corners, overfilled trays and large differences between shelves.
- Open surface barriers: Cut or perforate suitable fruits instead of extending every cycle to compensate for intact skin.
- Control liquid depth: Shallow, repeatable filling usually supports more predictable freezing and drying.
- Complete pre-freezing: Confirm product-center temperature and minimize thawing during transfer.
- Match the vacuum system: Fast pull-down helps protect frozen material, but stable loaded operation matters more than empty-chamber ultimate pressure.
- Match condenser capacity: The cold trap must handle peak vapor flow without a large pressure rise.
- Use product-temperature feedback: Increase heat only within the product’s safe process limit.
- Validate the endpoint: Remove unnecessary holding time without ending the batch before all trays meet the specification.
How to Confirm That Freeze Drying Is Complete
A product can feel dry outside while retaining moisture in its center. Therefore, the endpoint should combine process evidence with product testing.
Process Indicators
- Product-temperature response and stabilization.
- Pressure-rise testing after isolating the chamber.
- Comparison between suitable pressure measurements.
- Stable vapor load or mass-loss trend where available.
Product Acceptance Tests
- Final moisture content.
- Water activity at a defined temperature.
- Texture, color, shape and rehydration.
- Samples from different trays and chamber positions.
The U.S. FDA explains water activity as the water available for microbial growth and other reactions. However, a single water-activity threshold does not replace a product-specific hazard analysis, packaging test or shelf-life study.
In addition, freeze drying should not be treated as a validated kill step unless the product and process have evidence to support that conclusion. Covered food facilities must apply the food-safety requirements relevant to their market, product and operation.
Why Home Freeze Dryer Time Charts Do Not Fit Commercial Production
| Equipment level | Main purpose | Time interpretation | Scale-up value |
|---|---|---|---|
| Home unit | Household preservation and small recipes | Automatic schedules may combine freezing, drying and extra hold time. | Can show basic feasibility, but usually does not reproduce production-system heat, vacuum and condenser behavior. |
| Lab / pilot system | Recipe development and scale-up records | Cycle stages and sensor records can be developed for the intended production method. | High when the heating, condenser, vacuum and monitoring approach matches the larger system. |
| Commercial system | Regular batch production | Many documented food projects dry in about 8–15 hours, subject to product and loading. | Used for direct production and for planning expansion to larger equipment. |
| Industrial system | Factory-scale food production | Cycle time must include large-batch logistics, utilities, defrost strategy and plant scheduling. | Requires pilot data, factory layout, utility planning and acceptance conditions. |
Accordingly, a home freeze dryer time chart should not be copied into an industrial capacity proposal. Equipment scale changes heat transfer, vapor flow, condenser loading, sensor response, loading logistics, defrost time and sanitation planning.
When Pilot Testing Is Necessary
Pilot testing is strongly recommended when any of the following conditions apply:
- The product is new, proprietary or contains several ingredients.
- The food is liquid, concentrated, sugary, fatty, dense or skin-covered.
- The buyer needs a low final-moisture or strict water-activity target.
- Texture, color, aroma, rehydration or shape has a narrow acceptance range.
- The project must guarantee daily throughput, energy consumption or packaging stability.
- A laboratory result will be transferred to a commercial or industrial system.
A useful test report should include prepared wet weight, tray area, kg/m², thickness or liquid depth, pre-freezing conditions, temperature and pressure records, drying time, final moisture, water activity, product photographs, energy basis and observed defects.
For operating-cost planning, buyers can also review the freeze dryer electricity and utility guide.
Frequently Asked Questions
How long does it take to freeze dry food?
Many documented commercial food projects complete the drying stage in about 8–15 hours. Whole fruits such as whole strawberries, temperature-sensitive materials, thick products and extracts may require about 20 hours or longer. Preparation, pre-freezing, loading, unloading, defrosting and cleaning add more time to the full production cycle.
How long does it take to freeze dry fruit?
Project examples on this site range from 12 hours for apple, pineapple and pear slices to 13 hours for perforated blueberries and durian pieces. Thickness, skin, sugar, ripeness, loading density and final moisture can change the result.
How long does it take to freeze dry meat?
A documented Mongolia project dried approximately 121 kg of 10 mm meat chunks in 12 hours and reached 1.49% final moisture. Meat composition, fat level, thickness and quality targets may require another cycle.
Why do whole fruits, temperature-sensitive materials, thick products and extracts take longer?
Whole fruits have longer internal moisture paths and intact surface barriers. Temperature-sensitive materials often require lower heat input, while thick products and extracts need slower, more controlled moisture removal. Therefore, these materials may require 20 hours or longer, depending on loading, freezing conditions and endpoint targets.
Does pre-freezing reduce freeze drying time?
External pre-freezing can reduce machine occupancy and protect product structure. However, freezing rate and ice structure also affect drying resistance, so the fastest freezing method does not always produce the best overall cycle.
How many batches can a commercial freeze dryer run per day?
Divide 24 hours by the complete turnaround time, then apply a realistic utilization factor. A 12-hour drying stage does not automatically allow two full batches because loading, pull-down, unloading, defrosting and cleaning also use time.
Can a freeze drying time chart replace pilot testing?
No. A chart supports initial planning and reference selection. The engineering team should still run pilot tests when product structure, formulation, quality targets or equipment scale differs from the reference case.
Turn a Time Estimate into a Production Plan
A useful recommendation connects product testing with wet load, usable area, condenser load, vacuum stability, full turnaround time, daily capacity and factory utilities. Product data can be submitted for an engineering review before equipment selection.
Technical and Food-Safety References
These sources support the article’s discussion of drying parameters, endpoint checks, water activity and food-safety planning. Product-specific validation, packaging tests and shelf-life studies remain the responsibility of the food manufacturer.
- U.S. FDA: Water Activity (aw) in Foods — explains how available water relates to microbial growth and product stability.
- U.S. FDA: Preventive Controls for Human Food — outlines risk analysis, preventive controls, monitoring and verification requirements for covered facilities.
- Foods journal review: The Freeze-Drying of Foods — reviews how freezing, pressure, temperature and product properties affect the process and final quality.
- University of Minnesota Extension: Freeze-Drying Food Guidance — emphasizes uniform preparation and checking samples from different tray positions.

About the Author
Zheng Wei — Founder & Freeze-Drying System Engineer
Zheng Wei has participated in the freeze-drying projects documented on this website. His work covers product testing, equipment sizing, vacuum-system configuration, refrigeration planning, installation guidance and drying-process optimization for fruit, vegetables, prepared foods, seafood, meat and botanical materials.
Engineering data reviewed against the linked project pages. Last updated: June 19, 2026.