
Primary Drying: Shelf Temperature vs Food Temperature
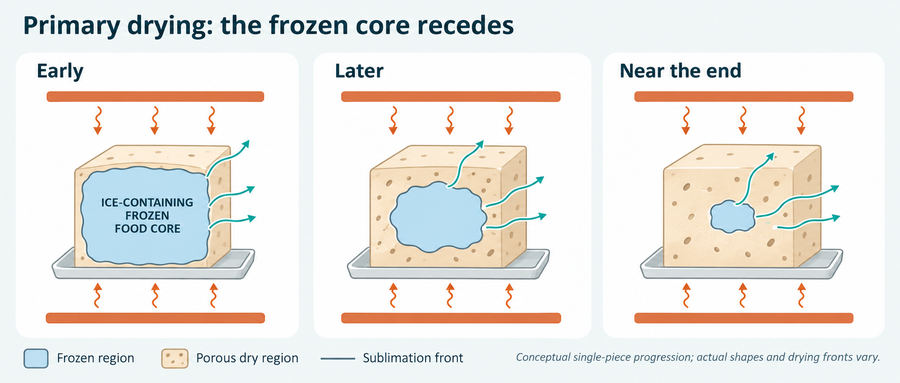
During primary drying, the heat source can be warmer than the frozen food because incoming heat is being used to turn ice into water vapor. In radiation-heated tray equipment, heating plates supply energy across gaps rather than relying on contact between a heated shelf and the tray. Cold, ice-containing regions can still coexist with warmer, already-dry material. That distinction matters when interpreting a temperature curve or considering more heat. Ratti, 2013.
Why can the shelf be warmer than the food?
Primary drying removes ice by sublimation: frozen water passes directly into water vapor. That change of state requires energy. While heat reaches an ice-containing region and vapor escapes, some of the incoming energy goes into removing ice rather than raising the temperature of the remaining food. A warm heat source and a much colder frozen region can therefore exist at the same time. This relationship explains why heating is part of primary drying even though the food still contains ice. Ratti, 2013.
The term shelf temperature needs care. In contact-heated equipment, it refers to the heated shelf supporting the tray. In radiation-heated equipment with separated plates, the relevant controlled heat source is the heating plate, which need not share the tray temperature. A setpoint is the temperature requested by the control program; a measured plate temperature is the reading at a particular sensing location; a food temperature describes the material at the measured location. Those three numbers answer different questions. Ratti, 2013.
There is a further distinction inside the food. The ice interface is the local boundary where ice is disappearing into vapor. As drying progresses, that boundary moves through the material. A stationary temperature probe does not automatically remain at it. Nor does a convenient single “product temperature” imply that the frozen region, dry region and every piece on a tray share one temperature. The food-tray monitoring work of Pisano, Barresi and Fissore (2011) highlights the difference between local measurements and descriptions of the wider drying process.
This distinction also explains an apparent contradiction: a shelf may be above a temperature associated with damage to a particular food material while an ice-containing region remains below that limit. The shelf number alone does not decide whether that material is being damaged. Equally, one cold food reading does not establish acceptable conditions throughout the load. The temperature of the relevant material, in its current state and location, is what needs interpretation. Ratti, 2013.
Follow the heat in and the water vapor out
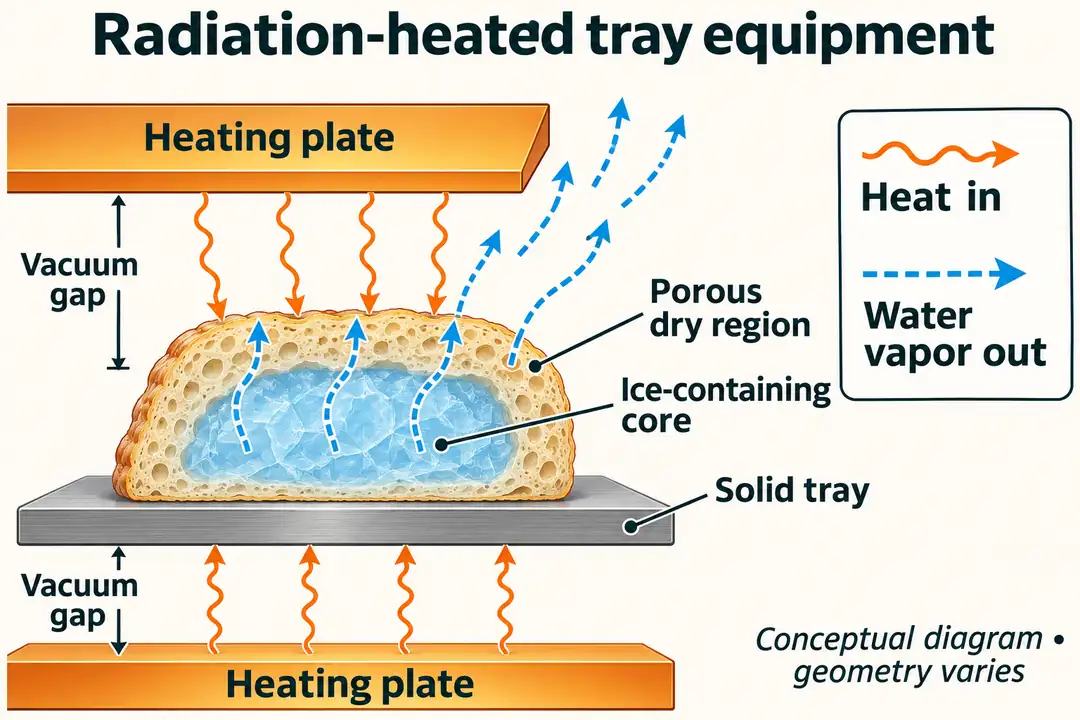
In the radiation-heated arrangement considered here, heating plates and the food tray are separated by gaps. Thermal radiation crosses those gaps and is absorbed by the exposed food or tray surfaces; it does not need circulating hot air. Energy can then travel by conduction within the tray and food. That internal conduction does not make the equipment a contact-heated design. Ratti, 2013.
The heat reaching a region depends on plate and receiving-surface temperatures, the surfaces’ ability to emit and absorb radiation, and how they face and expose one another. Tray geometry and loading can therefore change food-temperature histories even with the same controller program. This differs from a tray resting directly on a heated shelf, where the contact path also matters; residual gas conduction is pressure dependent. Food-tray monitoring research examines radiation from an upper shelf and shows why the heat-transfer arrangement matters. It does not establish one fixed radiation share or universal temperature uniformity. Pisano et al., 2011.
As an industrial example, GEA identifies its RAY and RAY Plus series as using radiation heating. That identifies a heating category; the diagram here is conceptual and does not reproduce a GEA machine or establish matching equipment specifications.
At the same time, the newly formed water vapor needs an outward path. It must pass through the food’s developing porous structure, enter the chamber and reach the vapor-collection system. Heat delivery and vapor removal are linked: a food region cannot sustain a higher sublimation rate merely because more heat is available if its vapor cannot leave at the corresponding rate. The wider relationship between freeze-drying temperature and pressure provides context for these two interacting paths. Ratti, 2013.
A small heat-balance example
A simplified, nearly steady heat balance makes the role of sublimation concrete:
Q̇sub ≈ ṁice × Lsub
Here, Q̇sub is the net heat rate used for sublimation, in watts or joules per second; ṁice is the ice-removal rate, in kilograms per second; and Lsub is the sublimation latent heat, in joules per kilogram. The Otto von Guericke University Magdeburg freeze-drying project page gives approximately 2.8 MJ/kg as the energy scale for water-ice sublimation.
For an illustrative calculation, suppose that 100 W of net heat is continuously used for sublimation alone. Using the approximate value of 2,800,000 J/kg gives:
(100 J/s × 3,600 s/h) ÷ 2,800,000 J/kg ≈ 0.129 kg of ice per hour.
This is an arithmetic teaching example. It assumes no temperature change, ignores heat losses and spatial variation, and assigns the entire stated net heat flow to sublimation. The 100 W is not the dryer’s electrical input. The result cannot predict equipment output, a shelf setting, cycle duration or efficiency. Its purpose is to show how heat can continuously remove ice without requiring a corresponding rise in food temperature. Actual warming or other uses of the incoming energy require a fuller balance.
Why does the temperature gap change during drying?
As ice sublimes from a food piece, it leaves a dry, porous region behind. The remaining frozen region can retreat inward while the outer food structure is largely retained, so the dry region becomes thicker rather than the ice simply moving downward. GEA’s single-piece schematics illustrate a shrinking frozen interior surrounded by a growing dry region. The actual front depends on the food’s geometry and structure; a tray of separate pieces need not behave as one flat boundary moving through a continuous layer. Ratti, 2013.
A longer or less permeable route can make vapor escape more difficult. Engineers describe this as increased resistance to water-vapor transport. Meanwhile, the path by which heat reaches the remaining ice also changes. Consequently, a constant shelf program can produce a changing food-temperature history. The actual structure and changing transport paths determine that history; different foods need not follow the same curve. Ratti, 2013.
Local drying adds another reason for the gap to narrow. Once little or no ice remains near a probe, that region can warm as less heat is consumed there by sublimation. Ice elsewhere may still be taking up heat and remaining colder. A probe may also cease to represent the moving ice interface as drying progresses. These are reasons to interpret a rising temperature as a local observation whose meaning depends on the probe’s surroundings. The grapefruit experiment discussed below provides a direct food example of warming while ice remained. Egas-Astudillo, Camacho and Martínez-Navarrete, 2021.
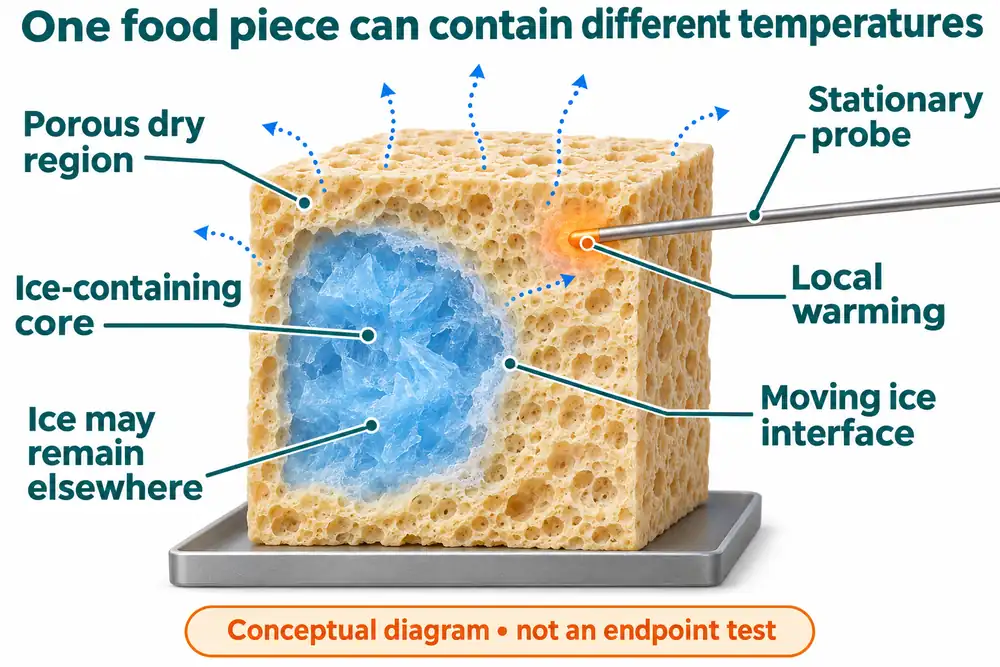
Measurement itself has limits. Food-tray research notes that a probe can disturb local heat and vapor paths, so the instrumented spot may behave differently from adjacent material. A useful interpretation therefore identifies where the reading came from and what region it can reasonably represent. The separate guide to food-temperature thermocouple placement covers the measurement question in more detail. A single warm reading cannot establish that every tray is free of ice, just as a single cold reading cannot establish that every dry region remains cool. Pisano et al., 2011.
Which temperature limit applies to the food?
Before a measured temperature can be judged, the relevant material state has to be identified. A frozen concentrate, a partially dried porous region and the finished dry food do not necessarily have the same temperature limits. Treating them as one material represented by a single shelf number loses that distinction. Ratti, 2013.
Collapse temperature, Tc, concerns observed loss of structure under specified test conditions. Tg′ concerns the glass transition of the maximally freeze-concentrated amorphous phase: the concentrated, noncrystalline part of the food that coexists with ice. A glass transition describes a change in that material’s mobility and rigidity; an observed collapse is a structural event. The concepts are related, but their measured temperatures are not interchangeable. The site’s explanation of collapse temperature and Tg′ develops the differences between the events and their measurement.
Crystalline constituents may also make melting or eutectic melting relevant. Already-dried material has its own state-dependent glass-transition behavior and quality limits. Its glass transition, Tg, should not be treated as the frozen concentrate’s Tg′. These distinctions matter because the food can contain frozen and dry regions simultaneously during primary drying. The appropriate limit depends on which region and condition are being evaluated, rather than on the stage name alone. Ratti, 2013.
A measured critical temperature is therefore conditional evidence about a sample, its state and the method used. There is no universal Tc–Tg′ difference that can be applied to all foods, and no universal conversion from either value to a shelf setting. The practical allowance also has to account for temperature gradients, time at the relevant conditions and measurement uncertainty. A fixed margin without that context cannot demonstrate protection of a particular food load.
The dry region near a heat source deserves attention alongside the remaining ice. Sublimation can keep the remaining ice relatively cold while nearby dry material becomes warmer. GEA’s radiation-heated example distinguishes surface and inner-food temperatures as drying proceeds. Keeping an ice-interface temperature below a relevant frozen-material limit does not by itself show that the dry surface remains within its own quality limits. A heating-program assessment therefore needs evidence about both regions. GEA, heat-transfer explanation and Figure 3; Ratti, 2013.
What did a grapefruit experiment reveal?
A study by Egas-Astudillo, Camacho and Martínez-Navarrete examined the temperature evolution of Star Ruby grapefruit puree. It included additive-free puree and formulations with gum arabic/bamboo fiber additions. Each aluminum container held approximately 27 g; the containers were 5.8 cm in diameter and 1 cm high. The 1 cm dimension describes the container height, not a documented exact puree-layer depth. Samples were prefrozen at −45 °C for six hours. Egas-Astudillo et al., 2021.
The work used a small Telstar freeze dryer at 5 Pa and compared a room-temperature condition of approximately 20 °C with a heated condition of 40 °C. Each run placed two containers with temperature probes and one without a probe on the central shelf, and the experiment was repeated twice. These details define the particular samples, geometry, measurement arrangement and scale behind the reported curves. They are experimental conditions, not a proposed program for industrial food batches. Egas-Astudillo et al., 2021.
The most useful observation came when the researchers interrupted drying as the local product temperature rose: some ice was still present. The paper discusses the possibility that a probe no longer contacts the moving ice interface. The observation shows that even these small samples could warm locally before all ice had disappeared. Egas-Astudillo et al., 2021, accepted manuscript p. 8 and Figure 3.
The temperature histories also included warming during loading, cooling after pressure reduction, a low-temperature period and later warming. They should not be reduced to a universal flat plateau followed by one definitive endpoint rise. The heated group dried faster under the study’s conditions, but the authors acknowledged that a proposed target product temperature could not yet be specified precisely and required further checks involving final temperature and moisture. Egas-Astudillo et al., 2021.
The study supports two useful conclusions together: added heat can help under particular conditions, and a temperature curve still requires careful interpretation. Its small laboratory setup does not validate a radiation-heated industrial machine or its heating geometry. Nor does the comparison establish 40 °C or 5 Pa as production recommendations, a transferable percentage improvement, or a temperature-only endpoint for a factory load. Different foods, heat-transfer arrangements, dimensions and loading require their own evidence.
When does more shelf heat help?
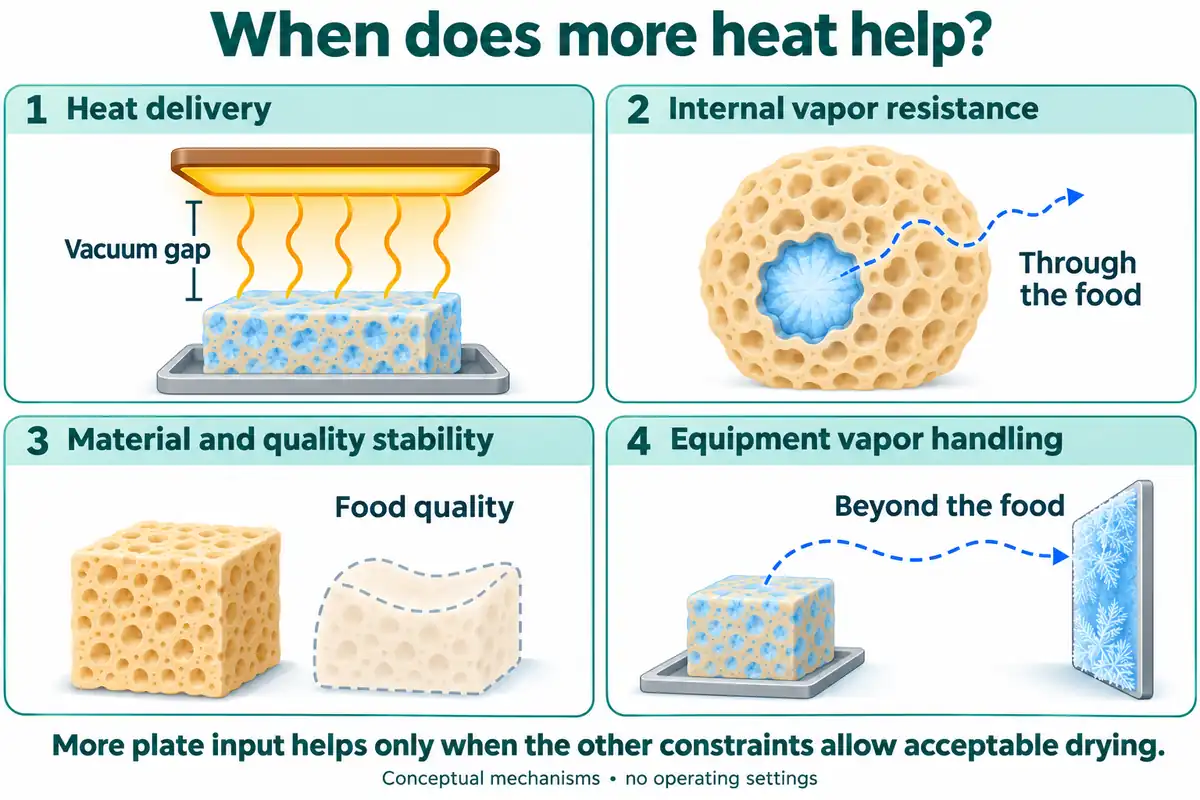
The practical question is whether additional heat actually speeds up ice removal while maintaining product quality. Because heat delivery and vapor escape operate together, four distinct constraints govern whether a proposed increase in heating will deliver useful production gains. Ratti, 2013.
Heat delivery can be limiting when insufficient energy reaches the ice-containing food. More heating-plate input may then increase sublimation if the other constraints allow it. In radiant equipment, however, the plate setpoint alone does not describe the radiation absorbed by each food region. Plate and surface temperatures, radiative properties, geometry and exposure affect delivery. A large plate-to-food temperature difference alone does not reveal the actual heat flow. Pisano et al., 2011.
Internal vapor resistance is a separate limitation. The food’s porous structure may restrict how quickly newly formed vapor can leave. Raising the shelf temperature does not by itself remove that resistance. As the balance changes, some of the added energy can contribute to warming rather than the intended increase in ice removal. The developing dry layer therefore belongs in the explanation of the result.
Material and quality stability sets another constraint. Even if more heat could remove ice faster, the temperatures reached by frozen and dry regions still have to be compatible with the required food structure and quality. A faster cycle that produces unacceptable food provides no useful production gain. This is why the relevant material limit and the finished-food requirements must accompany a time comparison.
Equipment vapor handling concerns the route beyond the food: vapor must move through the chamber and be collected while the intended drying conditions are maintained. This limitation is distinct from resistance inside the product. Temperature, chamber-pressure and condenser observations can help compare explanations, but a single trend cannot identify one unique bottleneck. More heat, or a lower pressure setting, should therefore not be assumed to produce faster acceptable drying. These distinctions follow from considering heat and mass transfer together. Ratti, 2013.
What makes a heating comparison useful?
A useful comparison keeps the food, preparation, freezing history, piece or layer geometry and loading comparable while the primary-drying heating program is varied. That makes it easier to relate differences in the outcome to the proposed change. The comparison should consider the full temperature and pressure histories, condenser behavior and finished-food observations. A single favorable point on a curve cannot describe the whole load or the entire cycle.
The outcome also needs a clear definition. An assessment of primary-drying completion addresses the remaining ice. In the grapefruit experiment, ice remained after the local temperature began rising. Egas-Astudillo et al., 2021. A production comparison also needs to evaluate final moisture, water activity where specified, and the required structure, texture or rehydration behavior as separate finished-food requirements. A local temperature rise cannot replace those assessments or establish food safety.
In a wider food freeze-drying cycle development program, comparing heat sources with actual food temperatures shows where incoming energy is consumed, how internal transport paths change as drying proceeds, and where dry regions begin to warm locally. For radiation-heated batch equipment, a proposed increase in heating-plate temperature should be evaluated cautiously against direct observations of the food: higher plate input helps only when the food remains acceptable throughout the load under actual loading.
References
- Ratti, C. (2013). Freeze drying for food powder production. In Handbook of Food Powders (pp. 57–84). https://doi.org/10.1533/9780857098672.1.57.
- Egas-Astudillo, L. A., Camacho, M. M., & Martínez-Navarrete, N. (2021). Impact of shelf temperature on a grapefruit puree temperature evolution during freeze-drying. International Journal of Food Science & Technology, 56(1), 413–419. https://doi.org/10.1111/ijfs.14656. First published online in 2020.
- Pisano, R., Barresi, A. A., & Fissore, D. (2011). Innovation in Monitoring Food Freeze Drying. Drying Technology, 29(16), 1920–1931. https://doi.org/10.1080/07373937.2011.596299.
- Otto von Guericke University Magdeburg, Institute of Process Engineering. Freeze-Drying. Research project page. University project page.
- GEA. RAY® Plus Freeze Dryer. Official product FAQ, conduction and radiation heating. Heating-category statement. Accessed 14 November 2026. Used for heating category only.
- Pedersen, T. B. (GEA). Overcoming common freeze drying challenges. Heat-transfer explanation and Figures 2–3. Official technical article. Accessed 14 November 2026. Qualitative mechanisms only; operating values and performance claims are not transferred.
Discuss an actual food load
For an industrial or commercial batch food freeze-drying project, production teams can discuss the food and loading conditions with the company. A useful starting point is the food and its preparation, piece or layer dimensions, wet mass per batch, existing temperature and pressure curves where available, and the required finished-food qualities. Those details provide a basis for a specific equipment and process discussion.
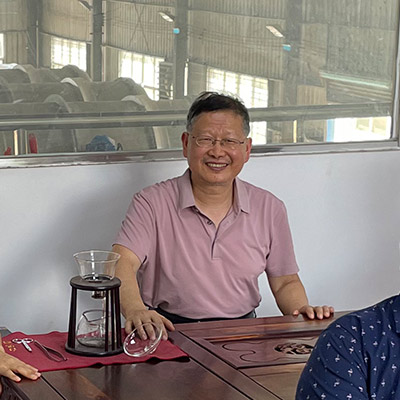
About the Author: Zheng Wei
Founder & Freeze-Drying System Engineer
Fuzhou Xing Shun Da Refrigeration Facility Project Co., Ltd.
Zheng Wei participates in food freeze-drying trials, equipment selection, vacuum-system configuration, refrigeration planning, installation guidance, process optimization, and project handover. The project experience covers fruit, vegetables, cooked foods, seafood, meat, dairy products, herbs, and extracts.