
Troubleshooting Wet Centers and Lengthening Cycles in Food Freeze Drying
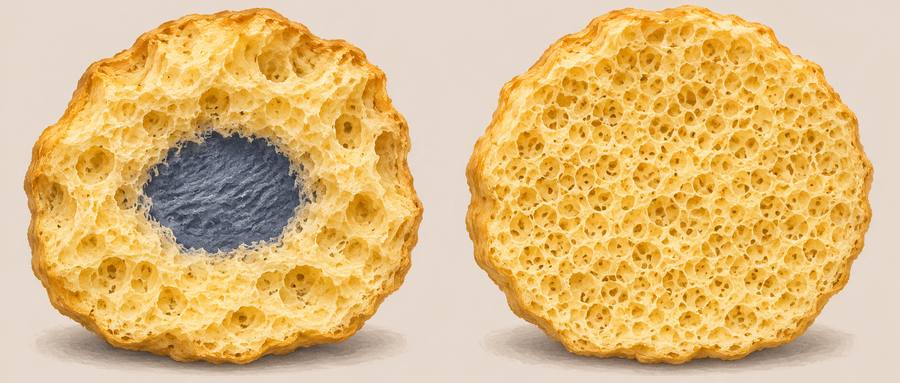
When a familiar freeze-dried food product unloads with soft centers or takes unexpectedly long to finish, the immediate decision is whether to inspect the food and handling line or look for a machine fault before changing recipe setpoints or calling for service. Modifying shelf temperatures or extending cycle timers without pinpointing the deviation risks masking upstream preparation shifts, while calling service prematurely can leave room exposure unaddressed. Determining whether under-drying stems from uneven drying during sublimation or moisture uptake after the chamber opens requires checking unloading timing, spatial patterns, and loaded machine trends against verified baselines.
Unloading Timing: When Did the Softness Appear?
The most informative initial observation occurs the moment the chamber door opens. A piece of food that leaves the tray with a cold or rubbery center suggests incomplete ice sublimation during primary drying, though texture and temperature alone do not prove residual ice or identify a unique cause. Conversely, product that unloads crisp across trays but turns soft after standing in the packaging room points toward moisture uptake from ambient air rather than an in-chamber drying failure. Because hygroscopic absorption can begin during chamber pressure recovery and tray unloading, checking whether softness is present immediately at opening or develops later guides the matched-sample comparison.
Freeze-dried food matrices contain extensive open pore networks left behind as ice sublimes. As noted in food preservation guidance from the University of Minnesota Extension, dehydrated foods readily take up moisture from surrounding air when transfer and packaging are delayed. In an uncontrolled packaging environment or during seasonal humidity increases, dried porous pieces absorb atmospheric water vapor directly through their porous structures. Attributing soft product to a freeze dryer fault while transfer staging remains unmonitored leads to unwarranted cycle extensions that leave packaging-room exposure unaddressed.
To evaluate room exposure against chamber drying, operators can draw representative pieces immediately upon chamber aeration, seal them in moisture-barrier sample containers at the door, and test them alongside matched pieces from equivalent tray positions evaluated after routine staging and packaging exposure using the plant analytical procedure. Prompt protected sampling reduces ambient confounding without eliminating it entirely, and a single comparison does not definitively separate every variable. If immediately protected samples satisfy dryness specifications while exposed counterparts gain moisture, the evidence supports a post-unload handling hypothesis and warrants reviewing packaging-room humidity controls, staging durations, and container sealing, as outlined in guidance for how to store freeze-dried food. If protected samples already exhibit dense, cold, or rubbery cores at the chamber door, the inquiry turns upstream to freezing, loading, or drying behavior.
Spatial Patterns: Checking Piece Thickness and Tray Positions
When under-dried pieces appear at the chamber door, checking whether wet centers follow thicker pieces or cluster in particular tray positions provides two competing hypotheses. Wet cores that track oversized fruit slices, folded vegetable leaves, overlapping cuts, or deeper tray fill suggest local mass-transfer limitations within individual portions. Conversely, when wet pieces recur across uniform sizes at specific chamber coordinates—such as a bottom shelf, door perimeter, or areas distant from the vapor port—the observation points toward localized heat delivery or vapor evacuation constraints. However, because fixed loading habits or upstream blast-freezer rack positions can repeatedly place specific material at identical chamber coordinates, recording spatial patterns helps narrow candidate causes rather than immediately establishing a diagnosis.
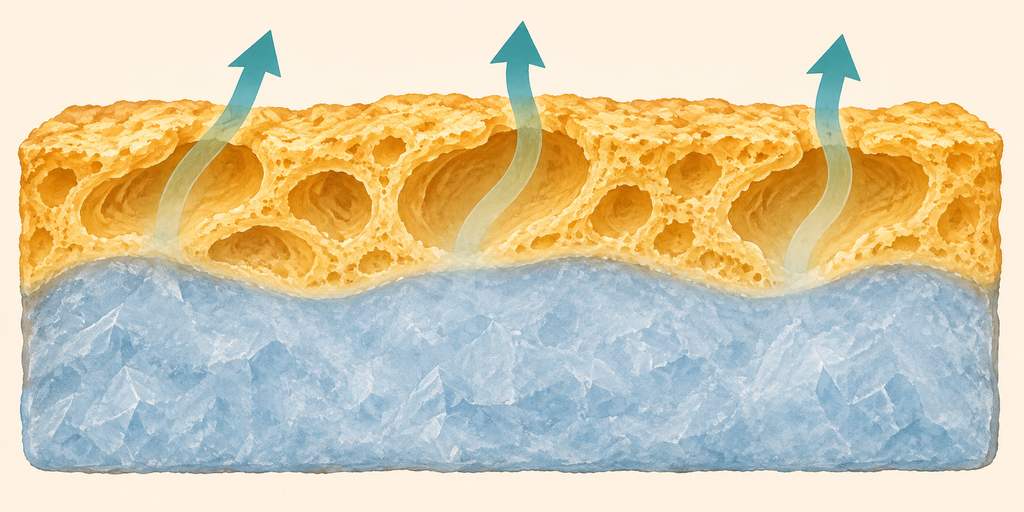
The physical mechanism linking piece geometry and layer depth to drying rates lies in vapor transport across the advancing dry layer. In their theoretical analysis, Luo and Shu (Procedia Engineering, 2017) explain that ice sublimation requires heat input to reach the receding sublimation interface, while released water vapor moves out through the porous dried layer toward the colder trapping surface that captures vapor where its equilibrium water-vapor pressure is lower than at the sublimation interface. Under comparable food formulation, freezing history, and tray loading, thicker pieces or deeper beds create a longer vapor pathway, allowing mass-transfer resistance of the dried layer to become more influential as sublimation proceeds. Consequently, under identical chamber setpoints, thicker portions can retain un-sublimated cores after adjacent thinner pieces have cleared primary drying, without this difference implying an equipment malfunction.
A common diagnostic trap is assuming that every repeatable zone pattern proves a failing heating shelf or uneven fluid circulation. Upstream handling often creates reproducible spatial artifacts. For instance, operators loading trays sequentially may pack final trays more densely, or blast-freezer airflow variations can produce distinct ice crystal structures on one side of a rack. In their small industrial study, Pisano, Barresi, and Fissore (Drying Technology, 2011) noted that side-wall thermal radiation can affect heat flux and temperature profiles between perimeter and interior trays, while pointing out that predominantly radiant suspended-tray arrangements require further investigation. Maintaining a consistent batch record of tray positions and pre-freezing conditions across comparable loads helps make this distinction rather than jumping to a hardware failure.
Trend Analysis: Comparing an Empty-Chamber Run with a Slowing Loaded Batch
Separating equipment deterioration from product variability requires comparing batch trends against verified baseline data collected under matched conditions. As outlined in engineering practices for freeze dryer service and maintenance, clean, dry, empty-chamber commissioning records provide an initial reference for baseline performance. These non-loaded checks evaluate ultimate chamber pressure, pull-down duration to target pressure, and approved static pressure-rise or leak checks under zero sublimation load. However, a normal dry empty run serves as a reference for those stated test conditions and does not provide blanket confirmation that every subassembly will meet ratings under full product sublimation loads.
Because a clean, dry, empty-chamber run has no product sublimation vapor load, it cannot replicate the dynamic heat- and mass-transfer demands of loaded food drying. During active primary sublimation, substantial volumes of low-pressure water vapor evolve from the food matrix and must travel continuously to the condenser surface, where the cold trap collects vapor as ice. When loaded chamber pressure rises above setpoint or cycles stretch unexpectedly, comparing measured heating surface behavior, chamber pressure, cold-trap temperature where instrumented, and representative product temperature if logged against historical batch logs under matched operating conditions narrows candidate causes, as detailed in core concepts of freeze drying temperature and pressure control.
Swipe or scroll to see all three columns.
| Observed Trend or Symptom | Candidate Explanations | Most Informative Next Comparison |
|---|---|---|
| Normal empty-chamber vacuum, but chamber pressure rises significantly above setpoint during loaded primary drying. | Sublimation vapor release potentially exceeds condenser refrigeration capture under observed conditions, vapor flow path is constrained, external leakage occurs, or pressure sensor readings reflect calibration drift. | Compare condenser temperature, cooling utility supply, and comparative condenser ice distribution against normal batch logs under matched loading; verify sensor plausibility. |
| Clean empty chamber exhibits slow pull-down to target vacuum, or excessive pressure rise during an approved isolation test. | External air ingress through door gaskets or piping seals, outgassing from internal residual moisture, contaminated pump oil, or vacuum gauge inaccuracy. | Check chamber dryness, drain valve position, door seal seating, and pump oil condition; have qualified personnel perform model-approved isolation or leak-rate checks before altering drying recipes. |
| Chamber pressure and condenser temperatures track normal trends, but drying duration lengthens uniformly across all trays. | Reduced heat transfer from distorted trays in contact-heated systems, altered shelf fluid circulation, or changed freezing history modifying pore structure. | In contact-heated systems, check tray flatness and shelf contact; compare blast-freezer time-temperature profiles and raw material preparation against baseline batches. |
| Wet centers occur selectively in oversized pieces, unevenly spread mounds, or localized tray depth variations. | Thicker product layers lengthen the dry-layer vapor path and can slow drying in thick portions under comparable preparation and identical chamber setpoints. | Audit slicing consistency, piece dimension tolerances, and tray loading uniformity across prep lines before modifying shelf temperature or cycle timers. |
Operators must avoid reacting to high loaded chamber pressure by indiscriminately raising shelf temperatures, because a high pressure reading alone does not establish the failure mechanism. If ice remains and vapor transport and capture permit it, additional thermal energy can increase sublimation and vapor load; if vapor flow or condenser capture limits drying, extra heat can raise the product temperature toward collapse or melt limits, making it essential to keep the core within product temperature limits. Conversely, operating at excessively low absolute chamber pressure can diminish gas-mediated heat transfer in equipment configurations that depend on gas conduction. Because the influence of absolute chamber pressure on heat transfer depends on the specific equipment design and tray arrangement, reviewing coupled shelf heating, chamber pressure, and refrigeration trends together guides the operational comparison.
Primary Drying Endpoint Versus Finished Batch Quality
Determining when primary drying has concluded across an entire food batch cannot rely on a single core temperature probe. In their monitoring study using a small industrial apparatus, Pisano, Barresi, and Fissore (2011) distinguished between sensors present during freezing, which can alter local ice nucleation, and sensors inserted into already frozen spinach cubes, where the authors proposed preferential vapor pathways from probe insertion as a possible explanation for observed rapid drying. In those frozen spinach trials, the portion of product around inserted probes dried faster and warmed toward shelf temperature before bulk monitoring indicated sublimation completion. Consequently, an individual rising probe temperature shows only that its monitored location has warmed; it does not demonstrate that unprobed food pieces throughout the chamber have completed primary drying.
Assessing batch progress across the load pairs local temperature indicators with whole-chamber bulk measurements. Comparing gas-composition-sensitive gauges, such as Pirani thermal conductivity sensors, with capacitance manometers measuring absolute pressure provides a whole-chamber clue about atmospheric composition when interpreted under matched cycle and load conditions. Where suitable isolation hardware is installed and approved procedures exist, pressure-rise testing can offer integrated evidence of remaining sublimation activity. These bulk methods supply batch-level indications rather than direct inspection of every food piece, helping operators evaluate overall chamber conditions as discussed in freeze dryer monitoring and batch records.
Finally, plant quality evaluations require distinguishing between primary ice sublimation, secondary desorption of bound moisture, and finished product quality. Finished release is decided by plant specifications and representative testing. As explained in U.S. FDA Inspection Technical Guide 39, total moisture measures all water held within the food matrix, whereas water activity (aw) reflects the equilibrium vapor pressure of water in the product relative to pure water at an identical measurement temperature. Because bound water interacts strongly with food constituents, products with comparable total moisture can display different water activity values at a stated temperature. Furthermore, freeze drying itself does not produce microbial lethality or guarantee shelf life; product release decisions and disposition of non-conforming batches remain governed by the applicable plant quality assurance protocol.
Confirming the Adjustment and Comparing Accepted Output
When troubleshooting suggests a candidate cause—such as blade wear during slicing, improper tray seating, or a leaking valve seal—the concrete next action is to compare the intended adjustment against an acceptable reference batch with product geometry, freezing history, total load, and sampling positions matched. While uncontrolled simultaneous adjustments obscure which modification resolved the deviation, a deliberate designed comparison can evaluate multiple planned factors systematically. To achieve an informative test, operators should record potential confounders, evaluate repeatability across the intended operating range, and verify finished product acceptance at representative tray positions, as detailed in food freeze drying cycle development.
Operational decisions must be evaluated by accepted dried food output across the full chamber turnaround cycle rather than running hours alone. Consider a hypothetical batch drying calculation producing 40 kg of accepted dried food per batch under identical quality release criteria:
- Case A (24-hour chamber occupation): 20 hours of drying time plus 4 hours of chamber turnaround (unloading, defrosting, cleaning, reloading) results in a 24-hour total chamber occupation time. Under continuous 24-hour-per-day operation, long-run average potential throughput equals 40 kg / day (40 kg × 24 h / 24 h).
- Case B (20-hour chamber occupation): 16 hours of drying time with the same 4-hour turnaround results in a 20-hour total chamber occupation time. Under continuous 24-hour-per-day operation, long-run average potential throughput equals 48 kg / day (40 kg × 24 h / 20 h), representing a 20% increase in chamber output potential.
While shorter cycle durations can increase long-run chamber output potential, the 48 kg / day figure represents a long-run mathematical average based on 40 kg of accepted dried product per completed batch, not a single-day lot size or guaranteed daily delivery. Realized plant output depends on total facility workflow, including whether staffing and shift boundaries can absorb the adjusted schedule. If pre-freezing takes place outside the chamber, it does not add to chamber occupancy and can run in parallel where blast-freezer capacity and production schedules allow. However, actual accepted throughput remains constrained by upstream preparation, freezing rates, packaging labor, and planned maintenance, and batches failing quality release cannot count toward accepted production. Facility-wide equipment sizing and turnaround factors are examined further in commercial batch freeze dryer capacity analysis.
When investigations reveal deviations beyond internal operational adjustments—such as excessive pressure rise during an approved empty isolation test, a demonstrated loss of loaded refrigeration capability, abnormal compressor noise, or electrical protective trips—operators should follow the plant approved response procedure and avoid unguided mechanical intervention. For unresolved equipment deviations, technical teams can consult qualified, model-specific service personnel through an engineering discussion and technical review, supplying documented empty baselines, loading details, and time-stamped temperature and pressure logs to support structured investigation.
References
- Pisano R, Barresi AA, Fissore D. Innovation in Monitoring Food Freeze Drying. Drying Technology. 2011;29(16):1920–1931.
- Luo N, Shu H. Analysis of Energy Saving during Food Freeze Drying. Procedia Engineering. 2017;205:3763–3768.
- University of Minnesota Extension. Preserving food at home: Freeze-drying. Reviewed 2025.
- U.S. Food and Drug Administration. Water Activity (aw) in Foods. Inspection Technical Guide 39.
About the Author: Zheng Wei
Founder & Freeze-Drying System Engineer
Fuzhou Xing Shun Da Refrigeration Facility Project Co., Ltd.
Zheng Wei participates in food freeze-drying trials, equipment selection, vacuum-system configuration, refrigeration planning, installation guidance, process optimization, and project handover. The project experience covers fruit, vegetables, cooked foods, seafood, meat, dairy products, herbs, and extracts.