
Freeze Dryer Energy Efficiency: A Food Factory Guide
Freeze dryer energy efficiency depends on how well heat input and water-vapor removal work together, how long the equipment runs, and how much acceptable food the batch produces. A lower power rating, a lower momentary demand or even fewer kilowatt-hours per batch can each give an incomplete answer.
For an industrial batch food operation, the useful question is how much energy a defined process uses to achieve a defined food result. That requires three connected explanations: where energy goes, what the reported energy figure is divided by, and how changes to heating, pressure and loading affect both drying time and usable output.
Where energy goes in a batch freeze dryer
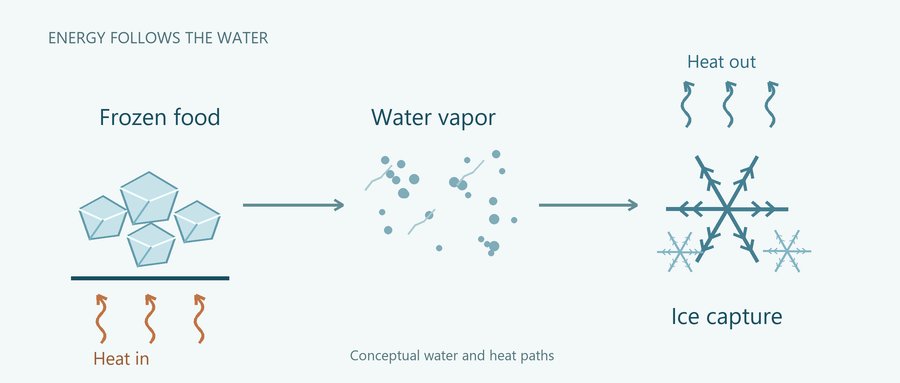
Follow the water through the machine. During primary drying, ice in the food changes directly into vapor, a process called sublimation. That phase change requires heat. In a tray freeze dryer, the shelves supply heat toward the frozen food, while the vapor travels away from it. Heating is therefore part of removing ice, even while the product remains frozen.
The vapor then reaches the cold trap, also called the ice condenser: a refrigerated collector where water vapor deposits as ice. Capturing that vapor releases heat, which the refrigeration system must remove. Product heating and cold-trap cooling can therefore operate simultaneously. They serve different parts of the same water-removal path.
The vacuum system maintains the required pressure environment and handles gas loads, including noncondensable gases and water vapor that reaches the pumps. Its electrical demand belongs in the measurement. Pumps, compressors and circulation equipment do not necessarily draw constant power throughout a batch; their loads depend on the stage, operating conditions, equipment configuration and controls.
The measurement boundary specifies which equipment, utilities and time interval are included. It may cover freezing the food, primary drying, secondary drying that removes remaining unfrozen water, and defrosting or other turnaround work. Controls, fluid circulation, cooling services and idle periods also matter when they fall inside that boundary. A drying-only reading and a complete production-cycle reading answer different questions.
Sublimation heat is a process heat requirement, not the reading on the electricity meter. Likewise, heat removed at the cold trap is not equal to the compressor’s electrical input. When a meter already includes electric heaters and refrigeration, adding their calculated process heat to that reading counts energy incorrectly. Imported steam or heat needs its own clearly stated measurement basis.
What the denominator changes
Power, measured in kW, describes the rate of energy use at a moment or as an average over an interval. Energy, measured in kWh, accumulates over time. Batch electricity is the integral of actual electrical power across the stated interval. A nameplate rating cannot replace that measurement. The separate guide to estimating batch electricity use and operating cost covers those calculations.
Two useful indicators relate included energy, E, to the mass of water removed. This article defines them as follows:
- Specific energy consumption, SEC = E / water removed, expressed as kWh/kg water removed.
- Specific moisture extraction rate, SMER = water removed / E, expressed as kg water/kWh.
The SMER name and unit appear in Barresi and Pisano’s review. The equations above state the definitions used here. SMER equals 1/SEC only when both calculations use the same energy basis, boundary and water mass. These are energy-intensity and water-removal indicators, not percentage thermodynamic efficiencies. Other publications may use a different SEC denominator, so its label and units must travel with the number.
Electricity per kilogram of wet feed describes processing the incoming load. Electricity per kilogram of water removed describes the dehydration duty. Electricity per kilogram of accepted dry product describes the usable output. Initial moisture, dry solids, final moisture and rejected material can change the comparison. Wet-basis moisture means water mass divided by the total mass of the material, including that water.
The following example is entirely hypothetical. Every number is a teaching assumption, not a company measurement, a published experiment or an equipment benchmark. Both batches start with 100 kg of already formulated wet feed at 85% moisture on a wet basis. No solids are lost, nothing is added, and no other volatile material is lost. All dried material, including rejects, finishes at 2% wet-basis moisture. This 2% assumption is not a universal food endpoint.
Each batch therefore contains 100 × (1 − 0.85) = 15 kg of dry solids. Total dried material is 15 / 0.98 ≈ 15.31 kg, and water removed is 100 − (15 / 0.98) ≈ 84.69 kg. Accepted product and rejected dried material together make up that same final mass in both batches.
| Measure | Batch A | Batch B |
|---|---|---|
| Included electricity, kWh | 200 | 180 |
| Accepted dry product, kg | 15 | 12 |
| Rejected dried material, kg | 0.31 | 3.31 |
| Electricity per wet feed, kWh/kg | 2.00 | 1.80 |
| SEC, kWh/kg water removed | 2.36 | 2.13 |
| SMER, kg water/kWh | 0.423 | 0.471 |
| Electricity per accepted dry product, kWh/kg | 13.33 | 15.00 |
Batch B uses 10% less electricity overall, yet uses 12.5% more electricity per kilogram of accepted product; the percentages use unrounded values. Rejected material remains in the water mass balance because its water was also removed. The example does not explain the rejection causes or show that a particular operating change damaged the food. It demonstrates why water removal and acceptable output need separate attention.
Why less heating or deeper vacuum may not save energy
Reducing shelf heating can lower instantaneous electrical demand while making drying take longer. If heat delivery limits sublimation, refrigeration, vacuum and other equipment may then operate for more hours. The total energy depends on their actual power over that longer period, not simply on the heater setting.
Increasing heat also has limits. The food may exceed a tolerable product temperature or lose its intended structure. Alternatively, the vapor path, cold trap or other equipment capacity may constrain water removal. More heat cannot be assumed to overcome those limits. A shelf setpoint is not the product temperature, so raising it requires evidence about what happens inside the food.
Relevant thermal limits also differ. Tg′ describes the glass transition of the maximally freeze-concentrated matrix; collapse temperature concerns structural failure, while eutectic temperature concerns melting in a crystalline system. They are not interchangeable settings. The guide to eutectic, glass-transition and collapse temperatures explains these distinctions.
An orange-snack experiment used about 160 g of formulated Navelina puree across four trays, 0.5 cm deep, in a Telstar LyoQuest 55 laboratory dryer. Each 100 g of puree received 5 g gum Arabic and 1 g bamboo fiber. Measured electricity covered drying, excluding 48 hours of external freezing.
At 5 Pa, a 30 °C shelf setting required 11 hours and 6.83 ± 0.06 kWh; 50 °C required 5 hours 50 minutes and 4.14 ± 0.05 kWh, reported as means ± standard deviations. Higher early power peaks accompanied less total drying energy because the process finished sooner. Final moisture was roughly 3.6–3.8%, without significant differences between groups; that does not establish equivalence across all quality attributes.
In that study, higher pressure shortened primary drying but extended secondary drying at the lower shelf temperatures tested. Judging only one stage would therefore miss part of the energy consequence.
These conditions describe one formulation and laboratory apparatus. They provide an example of the power-versus-time tradeoff, not settings for commercial food production or a promised saving. Neither deeper vacuum nor higher pressure guarantees the lowest total energy. The decision depends on the full measured interval and the finished food; detailed control relationships belong in the guide to how temperature and pressure work together in food freeze drying.
Loading and preparation change the problem
The way food is prepared changes the route that heat and vapor must travel. As drying progresses, vapor passes through material that has already dried. Its resistance to vapor movement is called dry-layer resistance. Thickness and pore structure affect that resistance, so a shelf setting alone cannot explain the drying rate. Luo and Shu’s analysis of food freeze drying examines these heat- and mass-transfer relationships through modeling and literature analysis.
A thinner layer can shorten the vapor path and reduce drying time, but may also reduce the amount loaded per batch. More material can spread some energy use across greater output, yet may increase transfer limitations or exceed available vapor-removal capacity. Neither the thinnest layer nor the fullest tray automatically gives the lowest energy per accepted kilogram. The useful comparison includes load, duration and final usable mass together.
Freezing influences the pore structure left as ice disappears. Preparation and pretreatment can also change the food’s structure, quality and drying behavior. Their value depends on the actual food and the energy they consume themselves. These mechanisms do not establish one preferred freezing rate, slice thickness or loading density for every product.
External prefreezing illustrates the difference between capacity and energy. Moving freezing to another freezer may release time in the freeze dryer, allowing a different production schedule. It also moves an energy-consuming step outside the dryer’s meter. A lower dryer-only reading can therefore coexist with unchanged or higher energy use across the complete preparation-and-drying route. Both meters and the same process boundary are needed to judge the energy result.
Endpoint changes require the same care. A shorter run is useful only if the required food result is still achieved. Product-specific evidence must support a revised endpoint; stopping with residual ice, excess moisture or unacceptable damage cannot establish improved efficiency for the intended product. This is why time saved, water removed and accepted yield need to remain connected.
Check an improvement against the same food outcome
A meaningful comparison begins with the same declared boundary, comparable raw material, formulation and initial moisture, and a fixed final quality target. Identify the parameter being tested. Heating, pressure or loading may deliberately change; requiring every setting to stay identical would prevent testing the proposed improvement.
Record the electricity, steam or delivered heat, cooling, external prefreezing, idle time and turnaround actually included. Keep the original utility quantities clear. Combine them only after declaring the conversion basis and avoiding overlapping measurements. Thermal kW and electrical kW must not simply be added as though they were the same purchased input, and heat produced from electricity must not be counted again when that electricity is already included.
Representative batches should show the variation in energy, water removal and accepted yield. One unusually favorable batch cannot support a general performance guarantee. The guide to system boundaries and environmental assessment covers broader accounting and environmental questions. Here, the essential result is a transparent energy figure tied to a repeatable food outcome.
Discuss the actual food and utility boundary
For a food factory planning an equipment project, useful starting information includes the food and its form, planned wet load per batch, final quality targets, and available batch utility records. Existing records are most useful when they show which equipment and production stages the meters cover. Share those project details for an equipment discussion grounded in the actual product and utility boundary.
References
- Luo, N.; Shu, H. Analysis of Energy Saving during Food Freeze Drying. Procedia Engineering, 205 (2017), 3763–3768. doi:10.1016/j.proeng.2017.10.330.
- Barresi, A. A.; Pisano, R. Process intensification and process control in freeze-drying. Proceedings of the 21st International Drying Symposium (2018). doi:10.4995/ids2018.2018.7652.
- Silva-Espinoza, M. A.; Camacho, M. d. M.; Martínez-Monzó, J.; Martínez-Navarrete, N. Impact of the Freeze-Drying Conditions Applied to Obtain an Orange Snack on Energy Consumption. Foods, 10(11) (2021), 2756. doi:10.3390/foods10112756.

About the Author: Zheng Wei
Founder & Freeze-Drying System Engineer
Fuzhou Xing Shun Da Refrigeration Facility Project Co., Ltd.
Zheng Wei participates in food freeze-drying trials, equipment selection, vacuum-system configuration, refrigeration planning, installation guidance, process optimization, and project handover. The project experience covers fruit, vegetables, cooked foods, seafood, meat, dairy products, herbs, and extracts.