
Food freeze-drying · Process understanding
Secondary Drying Shelf Ramp Rate in Food Freeze Drying
A shelf ramp tells the controller how quickly to change its temperature target. A food processor needs to know what that change does to the food: how quickly it warms, how much water remains, and whether the finished product still meets its quality requirements.
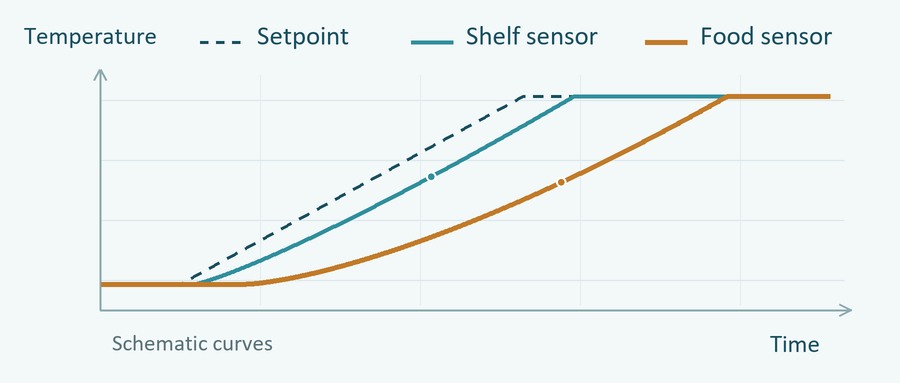
Choose a secondary-drying ramp from the food’s measured response and acceptable final condition. A steeper programmed ramp is not proof of a shorter acceptable cycle. Compare the entire ramp and hold, including product-temperature history, final moisture and quality. There is no universal food ramp rate supplied by this article.
What changes when the ice has gone
Primary drying removes ice by sublimation. Secondary drying removes residual, non-frozen water associated with the solid matrix through desorption and transport out of the material. Some desorption can occur while sublimation continues elsewhere, so the two mechanisms do not switch instantaneously throughout a batch. Food can look dry while it still contains water that matters to its stability and texture. [1]
During active sublimation, part of the heat supplied is consumed in changing ice into vapor. Once ice has disappeared at a location, that sublimation heat sink disappears there, and the local temperature can rise differently under the same heating input. Desorption still consumes energy; the end of sublimation does not mean that every bit of incoming heat only warms the solids. [1]
Before judging a new late-stage ramp, the process engineer should establish what the existing transition evidence shows. A temperature rise at one probe can indicate local ice depletion, but it does not establish that ice has disappeared from every piece or tray. Heating a load that still contains ice presents a different problem from warming a load whose remaining water is being desorbed.
The full transition procedure belongs in the plant’s cycle-development method. The food freeze-drying cycle development guide explains that broader task. Here, the important starting point is that a ramp comparison needs a comparable starting condition.
Read three temperatures during a shelf ramp
A programmed shelf ramp rate is the change in the controller’s temperature target divided by elapsed time, usually expressed in °C/min. The measured shelf temperature and the measured food temperature have their own time histories and slopes. They are not interchangeable with that programmed rate.
| Record | What it describes | What still needs checking |
|---|---|---|
| Programmed target | The temperature requested by the recipe over time. | Whether the heating system follows that request under the actual load. |
| Shelf or fluid sensor | The temperature at the installed sensor location. | Whether it represents the shelf surface or circulating fluid, and how other shelf positions behave. |
| Food sensor | The response near a defined measurement point in the food. | Probe contact and location, differences across the load, and the moisture and quality of the finished food. |
On a narrow screen, swipe the table horizontally to read every column.
Read these records together. If the programmed target changes quickly but the measured shelf follows slowly, the recipe is asking for a change that the loaded heating system is not delivering in the same way. If the shelf follows its target but the food warms differently across positions, changing the recipe alone will not explain that variation.
The engineer should also identify the heat path. Shelf-to-tray contact, radiant heating, tray geometry and the depth or arrangement of food can influence the response. Different equipment can use these paths differently. A fluid sensor does not automatically report the temperature of every shelf surface, and a probe describes its own location rather than the entire batch.
The schematic above illustrates one possible set of curves. It does not assert that food must always remain colder than a shelf or lag it by a fixed amount. The freeze-drying temperature and pressure guide covers the broader control relationship. The narrower question here is how a particular programmed slope appears in the actual shelf and food records. [1]
How moisture changes the warming limit
In an amorphous food component, water can act as a plasticizer: increasing moisture can lower its glass-transition temperature, Tg, and increase molecular mobility at a given temperature. During secondary drying, both food temperature and remaining moisture are changing. Heating and water removal therefore affect the material’s physical state together. [1]
Tg for a drying matrix at its current moisture content is different from Tg′, the glass transition of the maximally freeze-concentrated amorphous phase used in frozen-state characterization. A frozen-state Tg′ value is not a single temperature limit that describes the matrix throughout secondary drying.
For a sugar-rich amorphous matrix, warming while appreciable water remains can make structural change a concern. The engineer needs a material-specific understanding of temperature, moisture and the time spent in that condition. Simply labeling one profile “slow” does not establish that the structure or the final quality will be acceptable.
Whole pieces add another distinction. Cellular structure and the mixture of food components can change how a product shrinks or retains its shape. A glass-transition measurement is useful information, but it is not an instant, universal collapse switch for every food. Check the property that matters for the intended product, such as retained shape, crispness or rehydration, alongside the thermal and moisture evidence.
Structural stability and quality are separate judgments. A piece can retain its shape while an important flavor or color changes. Conversely, a change in shape is not enough to explain every quality result. The comparison should state which finished properties need to be preserved.
The food review reports different physical responses across materials and notes that a glass-transition explanation alone cannot describe pore formation or collapse in all dried products. No universal temperature margin, moisture target or ramp slope follows from the horseradish example or the bacterial desorption model. [1]
Compare the full ramp and hold
Compare complete profiles that aim to reach the same acceptable finished condition. Ramp duration by itself leaves out the hold, and neither duration describes how much water has actually left the food. A faster ramp may reach a target sooner while still needing a longer hold; a slower ramp also gives the food time at intermediate temperatures.
A time calculation, not a drying recommendation
Consider an illustrative temperature-target change of 20°C. These numbers are chosen only to explain the arithmetic; they are not proposed food operating settings.
| Program | Time for the 20°C target change | Hold | Ramp + hold |
|---|---|---|---|
| A | 100 min | 60 min | 160 min |
| B | 50 min | 110 min | 160 min |
Program B has half the programmed ramp duration, but both programs total 160 min. This establishes only the scheduled time. It does not establish equal food-temperature histories, equal residual moisture, equivalent quality, or suitability for a particular product.
For a useful plant comparison, keep the food formulation, preparation and freezing history, piece size or layer depth, tray loading, and starting condition comparable. Read the actual shelf and food traces through both ramp and hold. If those inputs change between runs, the result cannot be attributed to the ramp alone.
Judge the result in separate steps. First, check whether representative finished samples meet the required moisture condition, stating the test method and whether moisture is reported on a wet or dry basis. Then compare the required quality properties. Finally, compare the complete secondary-stage time for profiles that achieved an acceptable result. A quicker rejected batch is not an improvement in usable production.
A chamber-pressure trend or a food probe approaching shelf temperature can help interpret the process. It does not directly report the residual water content of every finished piece. Use finished-product measurements to confirm the endpoint rather than treating a process signal as a replacement for that evidence.
This is an engineering comparison framework, not a completed company trial or proof that either profile is superior. The cited food and bacterial research explains why material, moisture, temperature history and quality matter; it does not validate the hypothetical programs above for production. [1] [2]
Recheck the response when the food or equipment changes
Changing a formulation can change water binding and physical behavior. Changing layer depth, tray arrangement or the dryer can change how heat reaches the food. Even an unchanged recipe can therefore produce a different temperature history or final condition.
Before carrying a profile into the changed situation, compare measured responses at representative positions and confirm the finished moisture and required quality there. Choose positions from the actual loaded behavior rather than assuming that one named shelf or corner is always the worst case. Keep the detailed trial and transfer procedure with the plant’s established cycle-development method.
The useful conclusion is a bounded one: the selected profile worked for the stated food, loading, equipment and acceptance conditions. That is a stronger basis for the next batch than a shelf-ramp number copied without its context.
Discuss a food freeze-drying project
For an industrial batch food project, share the food form and formulation, intended loading, existing temperature profile if available, and required finished moisture and quality. These inputs help make an equipment and process discussion specific to the product. A literature value alone does not establish a validated production cycle.
Discuss the food projectReferences and evidence boundaries
- Nowak D, Jakubczyk E. The Freeze-Drying of Foods—The Characteristic of the Process Course and the Effect of Its Parameters on the Physical Properties of Food Materials. Foods. 2020;9(10):1488. doi:10.3390/foods9101488. Food-process review; material-specific findings are not universal operating settings.
- Trelea IC, Fonseca F, Passot S. Dynamic Modelling of the Secondary Drying Stage of Freeze-Drying Reveals Distinct Desorption Kinetics for Bound Water. Drying Technology. 2016;34:335–345. doi:10.1080/07373937.2015.1054509. Protected lactic-acid-bacteria formulation; the accepted manuscript was available in 2015. No fruit-piece ramp is inferred.
- Pääkkönen K, Roos YH. Effects of Drying Conditions on Water Sorption and Phase Transitions of Freeze-Dried Horseradish Roots. Journal of Food Science. 1990;55(1):206–209. doi:10.1111/j.1365-2621.1990.tb06053.x. Conditioned horseradish powder; laboratory sorption and thermal measurements, not production ramp validation.
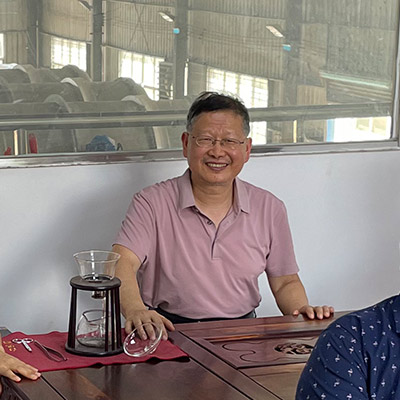
About the Author: Zheng Wei
Founder & Freeze-Drying System Engineer
Fuzhou Xing Shun Da Refrigeration Facility Project Co., Ltd.
Zheng Wei participates in food freeze-drying trials, equipment selection, vacuum-system configuration, refrigeration planning, installation guidance, process optimization, and project handover. The project experience covers fruit, vegetables, cooked foods, seafood, meat, dairy products, herbs, and extracts.