
Food freeze-drying • Phase behavior
Eutectic Temperature in Freeze Drying: What It Means for Foods
A thermal analysis report can provide useful guidance for food freeze drying. But a reported temperature helps only when you know what physical event was measured and how closely the test sample matches the product on your trays.
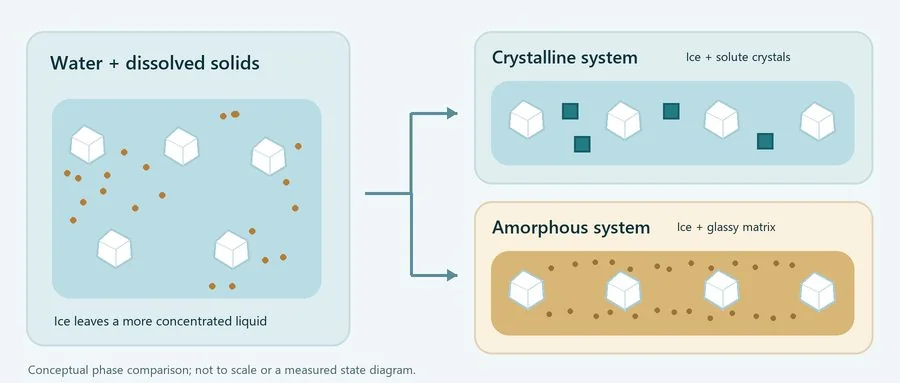
Eutectic temperature is a crystalline melting boundary, not a universal freeze-drying setting. In a simple water–solute eutectic system at a specified pressure, liquid can coexist with ice and a crystalline solute phase at the eutectic temperature. Many foods also contain an amorphous, freeze-concentrated phase, so glass transition and structural collapse can matter instead of, or alongside, eutectic melting. The relevant observation belongs to the particular formulation and preparation method. [1]
What eutectic temperature means
Consider a dilute aqueous solution whose solute can crystallize. As ice forms, water leaves the liquid phase while dissolved solids become more concentrated in the liquid that remains. Ice appearing in the sample therefore marks the start of a changing mixture; it does not show that every relevant component has crystallized.
In the ideal binary eutectic case, continued equilibrium freezing brings the remaining liquid to the eutectic composition. Ice and the crystalline solute phase then form together at the eutectic temperature. On warming a fully crystallized sample, eutectic melting can introduce liquid before all the ice has melted. During primary drying, that liquid can compromise the structure intended to remain while ice sublimes. [1]
Actual cooling does not necessarily follow the equilibrium picture. Nucleation and crystallization take time, and a sample may supercool or form an amorphous phase. A cooling event, first visible ice and a melting event on warming are therefore not interchangeable evidence of the same boundary. Composition and thermal history must accompany a reported temperature. [1] [5]
For a food process engineer, the practical question is which phases actually form in the prepared food formulation being freeze-dried. A temperature taken from an individual ingredient or a different formulation cannot answer that question. Start with evidence from the food matrix you plan to dry, and check what transition was observed before using the reported value.
Why many foods need a different thermal limit
Dissolved sugars and other food solids need not crystallize during freezing. Ice can instead surround a concentrated, amorphous phase: its molecules lack the long-range order of a crystal. As that phase becomes colder and more viscous, it can become glassy before all water has turned into ice. A frozen-looking food can therefore contain both ice and unfrozen water within its concentrated matrix. [1]
| Reported quantity | What it describes | How to interpret it |
|---|---|---|
| Eutectic melting temperature, Te | Melting involving the relevant crystalline phases and liquid. | Useful when those crystalline phases actually form. It does not identify every transition in a complex food. |
| Glass transition, Tg′ | The glass transition of the maximally freeze-concentrated amorphous phase. | A material-state observation. It is distinct from the glass transition of the dried product and from a directly observed collapse temperature. |
| Collapse temperature, Tc | Observed loss of structure under the specified drying and observation conditions. | Method and conditions matter. There is no universal numerical offset that converts Tg′ into Tc for foods. |
These distinctions draw on frozen-state analysis and thermal/microscopy methods. [1] [2] A food containing crystalline and amorphous components may require more than one observation; a single ingredient name cannot establish which phase controls its behavior.
Thermal history also changes the state being tested. Holding a frozen material at an appropriate temperature—often called annealing—can allow further crystallization or changes in ice structure. Its effect depends on the material and the hold conditions. It is not a universal step, nor does it always shift a measured transition in one direction. A result obtained after annealing should not silently be applied to an unannealed batch. [1] [2]
The triple point of water addresses a different question: the pressure–temperature conditions for water’s phases. It does not supply the formulation-specific eutectic or collapse limit of a food.
What a thermal test can tell you
The test method determines what the temperature refers to. Differential scanning calorimetry (DSC) follows heat-flow behavior during a temperature program; melting, crystallization and glass transition give different kinds of signals. Differential thermal analysis (DTA) follows the temperature difference between a sample and a reference. Freeze-drying microscopy observes a small sample during drying and can identify structural change under those particular conditions. A thermal signal and an image of collapse answer related questions, but they are not the same measurement. [2] [5]
A usable report links its temperature to the formulation, sample preparation and physical event observed. Check whether data came from cooling or warming, whether any hold or annealing was used, and whether the reported value marks an onset or a peak. If the test method or reading is unclear, clarify it before using the number as a product limit.
Microscopy adds a further boundary. Kett’s methods review cautions against extrapolating collapse data from glass-transition data, or assuming that a small microscopy sample fully represents drying behavior at another scale. Its pharmaceutical examples support that measurement caution; their numerical values do not become food-process settings. [2]
How the limit relates to a food batch
A shelf setpoint supplies heat; it is not a direct reading of the food. During primary drying, sublimation consumes heat while the growing dry layer affects vapor flow. Heat transfer, product geometry and drying progress therefore influence the product’s temperature. In the Tremella study, the measured center-temperature curve differed substantially from the heating-plate curve before approaching it later in drying. That is a useful qualitative distinction, not a factory-scale operating guarantee. [3]
A product sensor also measures a particular location. Its result does not establish the hottest location, the sublimation-interface temperature or the state of every portion of a tray. Expert discussion of freeze-drying measurements similarly distinguishes individual product observations from batch averages and emphasizes scale and measurement limitations. [4]
A thermal result is one input to assessing a batch; a thermal limit alone does not establish an acceptable cycle or acceptable finished food. Formulation, preparation, tray loading and drying conditions all influence the outcome. Rather than copying a generic safety allowance, determine an operating margin from the actual measurement uncertainty and process variation. In a representative load, track product observations and temperature at relevant tray positions, and compare the dried food against your required finished quality.
The next question is how the product responds in the proposed load. The food freeze-drying temperature and pressure guide explains how shelf heating and chamber pressure interact to govern product temperature during cycle development.
Discuss a food freeze-drying project
Food processors planning a new or expanded batch line can share the formulation, product form, prepared wet load, tray depth and finished-product requirements. Include an existing thermal report or trial curve when available, with its test conditions. These inputs make the equipment and process discussion more specific; a literature temperature alone does not define the required cycle.
References and evidence limits
- Roos YH. Frozen state transitions in relation to freeze drying. Journal of Thermal Analysis. 1997;48:535–544. doi:10.1007/BF01979500. Used for crystalline/amorphous state behavior and thermal history; no ingredient-table temperature is recommended as a food recipe.
- Kett V. Development of Freeze-dried Formulations Using Thermal Analysis and Microscopy. American Pharmaceutical Review. 2010. Used for method distinctions and extrapolation limits; pharmaceutical formulation values are not transferred to foods.
- Li Y, Chen S, Tang B, Wu L, Lai P. Eutectic point and freeze-drying curve of Tremella fuciformis containing sucrose. Food Science and Technology. 2022;42:e98521. doi:10.1590/fst.98521. Used as an attributed laboratory food example; reported event labels and scan-rate inconsistency remain relevant limitations.
- Freeze Drying: The Experts’ View. Pharmaceutical Technology. 2012. Named-expert discussion supports measurement/scale cautions; it does not establish food validation criteria or company capabilities.
- Biopharma Group. Introduction to Freeze Drying. Introductory guide, 2023 version. Used for general freezing and thermal-method context; vendor equipment specifications and services are not attributed to the company.

About the Author: Zheng Wei
Founder & Freeze-Drying System Engineer
Fuzhou Xing Shun Da Refrigeration Facility Project Co., Ltd.
Zheng Wei participates in food freeze-drying trials, equipment selection, vacuum-system configuration, refrigeration planning, installation guidance, process optimization, and project handover. The project experience covers fruit, vegetables, cooked foods, seafood, meat, dairy products, herbs, and extracts.